
Influenza in Sweden – Season 2025–2026
Summary
The 2025–2026 influenza season was characterised by an early start and two peaks, one in early January and one in mid-February. Influenza A dominated the season, with cocirculation of both subtypes. Influenza A(H3N2) dominated overall (64 percent), specifically the K variant, and particularly during the first peak. Influenza A(H1N1)pdm09 increased later and contributed substantially to the second peak. A small rise in influenza B was observed late in the season, with a small number of cases compared to prior influenza B epidemics. Overall, the season was moderately severe, with approximately the same number of hospitalisations, intensive care admissions, and deaths as in the previous season. Partly because of the double peak, hospitalisations and deaths were higher than other recent seasons since the COVID-19 pandemic. Cases reached a medium level in both peaks, and excess mortality was seen during one week. For the first time since 2020, influenza caused a higher burden of disease than COVID-19 in terms of hospitalisations, patients in intensive care, and deaths.
The RSV season began later than usual and was less intense compared to the previous three seasons. During the season, all newborns were offered monoclonal antibodies against severe RSV infection för the first time, and a majority of parents accepted the offer. A significant decrease in the burden of disease among children under 6 months of age, compared to the previous season, clearly showed the effectiveness of the intervention.
Reported cases of COVID-19 were low throughout the autumn and winter with no distinct epidemic peak.
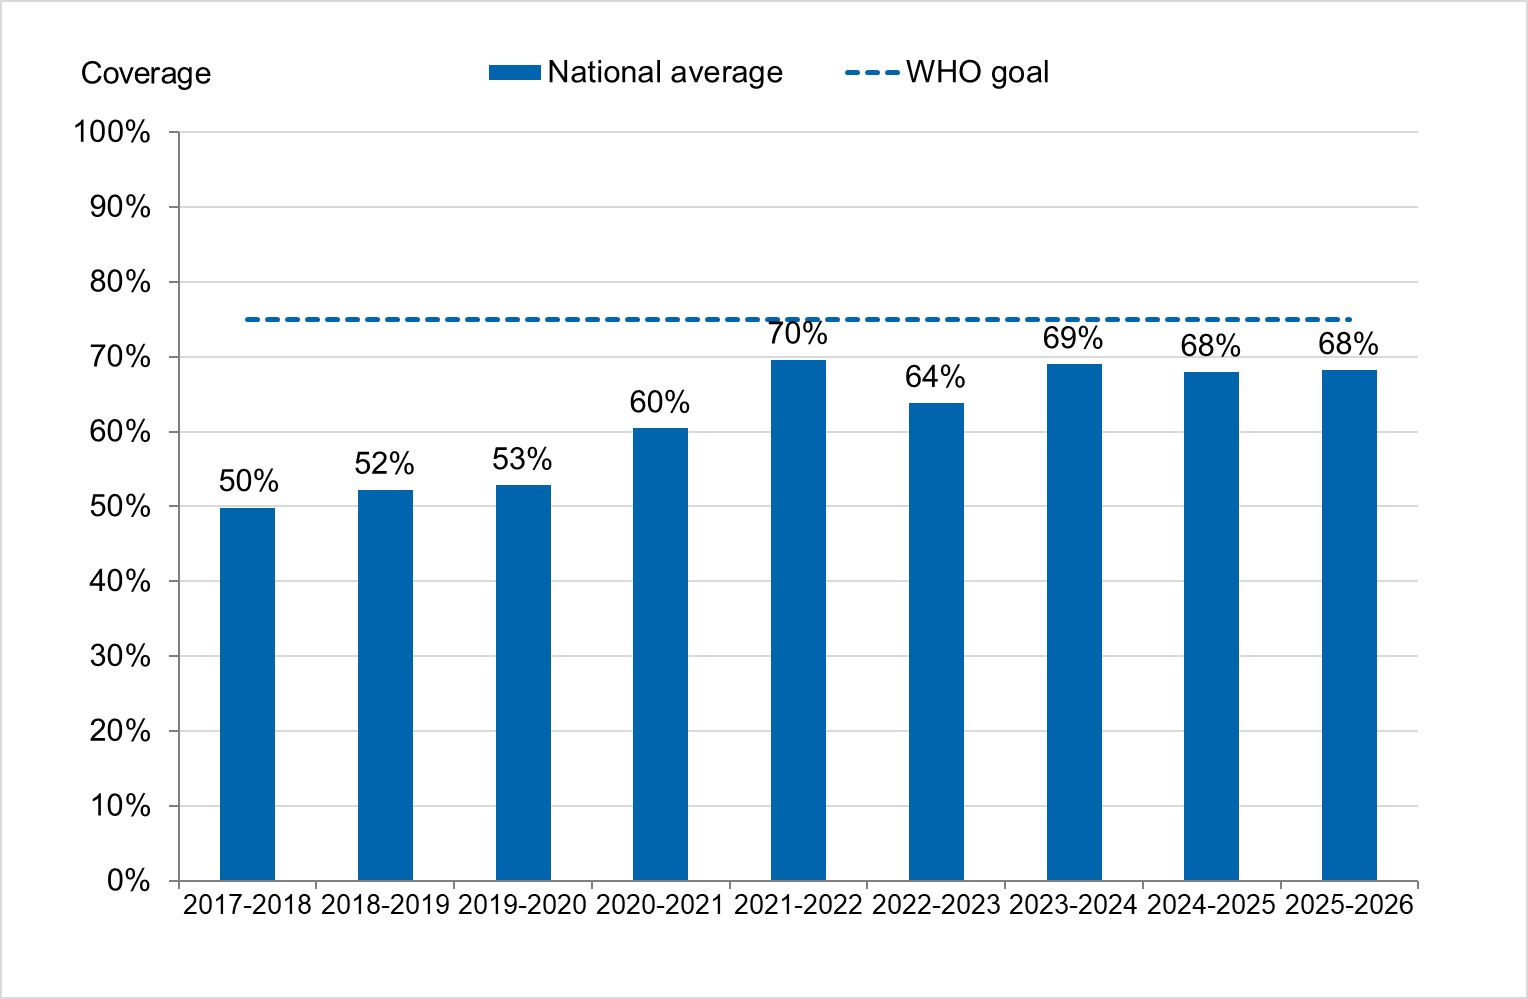
Influenza vaccination coverage after the 2025–2026 autumn dose was estimated at 68 percent among persons aged 65 years and older, similar to the previous two seasons and the 2021–2022 season, and considerably higher than the seasons before the COVID-19 pandemic. The high coverage seasons are those in which co-administration of influenza and COVID-19 vaccination was offered. Because the age cut-off for COVID-19 vaccination was raised from 65 to 75 years, the group recommended both vaccines was smaller this season. Vaccination coverage for COVID-19 was estimated at 74 percent for those aged 75 or older. High media attention around the K variant of influenza A(H3N2) may have contributed to high vaccination coverage for both influenza and COVID-19.
During the season, the highest weekly and cumulative notification rate of laboratory-confirmed influenza and hospitalised cases with influenza or pneumonia was seen among persons aged 65 years and older, followed by children aged 0–4 years. This is the expected pattern because these age groups are typically most affected by severe illness in an influenza epidemic and are more often tested for influenza. The total number of hospitalised patients with a primary diagnosis of influenza or pneumonia (8,391) was comparable to the previous season, but this season had two epidemic peaks. The median age for hospitalisations was 76 years.
The number of influenza cases in intensive care overall and the height of the peak (week 1, 2026) was comparable to the past three seasons, although data are somewhat incomplete for the end of the 2025–2026 season. Intensive care patients had a median age of 66 years. The total number of deaths within 30 days of diagnosis was similar to the previous season (2024–2025) and higher than during the preceding six seasons. The median age of deaths was 85 years. Excess mortality was measured in week 1, 2026, near the first peak of the influenza season.
Of the subtyped influenza A samples within laboratory reporting, 64 percent were A(H3) and 36 percent were A(H1)pdm09. Subtyping in sentinel surveillance and among hospitalised patients showed a similar distribution, while a higher percentage of cases treated in intensive care were A(H1)pdm09 (46 percent). This may reflect the known differences between subtypes in terms of typical age and severity of infection, where A(H1)pdm09 is more likely to cause severe infections among younger adults, who are more likely to be treated in intensive care. The proportion of A(H1)pdm09 was also higher (47 percent) among deaths, but subtyping data are limited (subtyping data were only available for approximately 25 percent of deaths).
A selection of influenza-positive samples received from clinical microbiological laboratories and collected through sentinel surveillance were further characterised at the Public Health Agency of Sweden (PHAS). During the season, the HA gene of 252 viruses was characterised for genetic group affiliation:
- A(H1N1)pdm09-viruses: The predominant type among the characterised Swedish viruses was subclade D.3.1, part of clade 5a.2a.1. During the season, subclade D.3.1 further diversified into D.3.1.1. For the 2026–2027 influenza season in the Northern Hemisphere, an updated vaccine strain within subclade D.3.1 is recommended for influenza A(H1N1)pdm09.
- A(H3N2)-viruses:A majority of the analysed viruses, 84 percent, belonged to subclade K (J.2.4.1) in genetic group 2a.3a.1. Vaccine effectiveness studies for the Northern Hemisphere’s A(H3N2) vaccine during the 2025–2026 season have shown moderate protection, at levels comparable to the 2024–2025 season. For the 2026–2027 influenza season in the Northern Hemisphere, a vaccine strain within subclade K is recommended for A(H3N2).
- B/Victoria-viruses: All the characterised viruses belonged to genetic group V1A.3a.2, with varying distribution amongst subclades C.5.6, C.5.6.1, and C.5.7. Viruses within these subclades were well recognised by the 2025-2026 northern hemisphere vaccine for influenza B/Victoria. The recommended vaccine strain for the Northern Hemisphere 2026-2027 season belongs to subclade C.3.1 and shows good recognition of circulating viruses in genetic group 3a.2.
Analysis of genetic markers associated with reduced susceptibility to the neuraminidase inhibitors oseltamivir and zanamivir, to the endonuclease inhibitor baloxavir marboxil, and to amantadine was performed in the NA, PA, and M genes of 251, 240, and 220 influenza viruses, respectively. Seven of the viruses carried amino acid substitutions previously known to show reduced susceptibility to oseltamivir or zanamivir. No viruses carried amino acid substitutions associated with reduced susceptibility to baloxavir marboxil. All Swedish influenza A viruses were resistant to amantadine. In summary, Swedish samples had low levels of resistance to currently used antivirals.
Sammanfattning
Influensasäsongen 2025–2026 kännetecknades av en tidig start och två toppar, en i början av januari och en i mitten av februari. Influensa A dominerade säsongen, med samtidig cirkulation av båda subtyperna. Influensa A(H3N2) dominerade överlag (64 procent), särskilt K-varianten, framför allt under den första toppen. Influensa A(H1N1)pdm09 ökade senare och bidrog väsentligt till den andra toppen. En liten ökning av influensa B sågs sent under säsongen, med få fall jämfört med tidigare influensa B-epidemier. Sammantaget rapporterades ungefär lika många slutenvårdade, intensivvårdade och avlidna bekräftade influensafall som föregående säsong. Delvis på grund av de två topparna var antalet slutenvårdade och avlidna högre än de andra säsongerna sedan covid-19-pandemin. Antalet fall var på medelhög nivå under båda topparna, och överdödlighet sågs under en vecka. För första gången sedan 2020 orsakade influensa en högre sjukdomsbörda än covid-19, när det gäller antalet slutenvårdade, intensivvårdade och avlidna.
Säsongen för RS-virus inleddes senare än vanligt och var mindre intensiv jämfört med de tre föregående säsongerna. Under säsongen erbjöds alla nyfödda barn för första gången skyddande antikroppar mot allvarlig RS-virusinfektion, och en majoritet av föräldrarna accepterade erbjudandet. En tydlig minskning i sjukdomsbördan bland barn under 6 månaders ålder jämfört med föregående säsong visar effekterna av insatsen.
Antalet rapporterade fall av covid-19 var lågt under hela hösten och vintern, utan någon tydlig vintertopp.
Vaccinationstäckningen mot influensa efter höstdosen 2025–2026 uppskattades till 68 procent bland personer 65 år och äldre, liknande de två föregående säsongerna och säsongen 2021–2022. Det är avsevärt högre än säsongerna före covid-19-pandemin. Vaccinationstäckningen var hög de säsonger då samvaccination mot influensa och covid-19 erbjöds. De grupper som rekommenderades båda vaccinationerna omfattade dock färre personer under 2025–2026, eftersom åldersgränsen för covid-19 vaccinationen höjdes från 65 till 75 år. Vaccinationstäckningen mot covid-19 uppskattades till 74 procent för personer 75 år eller äldre. Stor medieuppmärksamhet kring K-varianten av influensa A(H3N2) kan ha bidragit till den höga vaccinationstäckningen mot både influensa och covid-19.
Under säsongen var antalet bekräftade fall av influensa och slutenvårdade patienter med influensa eller lunginflammation högst bland personer 65 år och äldre, följt av barn i åldern 0–4 år. Detta är det förväntade mönstret, då dessa åldersgrupper vanligtvis drabbas mer allvarligt under en influensaepidemi och oftare testas. Det totala antalet slutenvårdade patienter (8 391) var jämförbart med föregående säsong, men denna säsong hade två toppar. Medianåldern för slutenvårdade patienter med influensa eller lunginflammation var 76 år.
Antalet intensivvårdade patienter kumulativt och under toppen (vecka 1, 2026) var jämförbart med de tre senaste säsongerna, även om data för säsongen 2025–2026 är ofullständiga. Intensivvårade patienter hade en medianålder på 66 år. Antalet dödsfall inom 30 dagar efter diagnos var liknande föregående säsong (2024–2025) och högre än under de sex föregående säsongerna. Medianåldern för dödsfallen var 85 år. Överdödlighet uppmättes under vecka 1, 2026, i anslutning till influensasäsongens första topp (vecka 1, 2026).
Av de subtypade influensa A-proverna inom laboratorierapporteringen var 64 procent A(H3) och 36 procent A(H1)pdm09. Subtypning inom sentinelövervakning och bland slutenvårdade patienter visade en liknande fördelning, medan en högre andel av fallen inom intensivvården var A(H1)pdm09 (46 procent). Detta kan återspegla de kända skillnaderna mellan subtyperna avseende typisk ålder och allvarlighet, där A(H1)pdm09 är mer benägen att orsaka allvarliga infektioner bland yngre vuxna, som oftare behandlas inom intensivvård. Andelen A(H1)pdm09 var också högre (47 procent) bland dödsfallen, men subtypningsdata är begränsade (subtypningsdata är tillgängliga för cirka 25 procent av dödsfallen).
Ett urval av influensapositiva prov, inkomna från kliniska mikrobiologiska laboratorier och insamlade genom sentinelövervakning, karakteriserades vidare på Folkhälsomyndigheten. Under säsongen karakteriserades HA-genen hos 252 virus för genetisk grupp-tillhörighet:
- A(H1N1)pdm09-virus: Den dominerande typen bland de karaktäriserade svenska virusen var subklad D.3.1, en del av klad 5a.2a.1. Subklad D.3.1 förgrenades under säsongen ytterligare till D.3.1.1. Inför influensasäsongen 2026–2027 på norra halvklotet rekommenderas en uppdaterad vaccinstam inom subklad D.3.1 för influensa A(H1N1)pdm09.
- A(H3N2)-virus: Majoriteten av de analyserade virusen, 84 procent, tillhörde subklad K (J.2.4.1) inom genetisk grupp 2a.3a.1. Vaccineffektivitetstudier för norra halvklotets A(H3N2)-vaccin under säsongen 2025–2026 har visat på måttligt skydd, på nivåer jämförbara med säsongen 2024–2025. Inför influensasäsongen 2026–2027 på norra halvklotet rekommenderas en vaccinstam inom subklad K för A(H3N2).
- B/Victoria-virus: Alla de karakteriserade virusen tillhörde genetisk grupp V1A.3a.2, med varierande fördelning bland subkladerna C.5.6, C.5.6.1 och C.5.7. Dessa subklader kändes väl igen av 2025–2026 års vaccin för norra halvklotet mot influensa B/Victoria. Den rekommenderade vaccinstammen för norra halvklotets säsong 2026–2027 tillhör subklad C.3.1, vilken uppvisat god igenkänning av virus inom övriga subklader i genetisk grupp 3a.2.
Analysen av genetiska markörer förknippade med minskad känslighet för neuraminidashämmarna oseltamivir och zanamivir, endonukleashämmaren baloxavir marboxil samt amantadin utfördes på NA-, PA- och M-generna hos 251, 240 respektive 220 influensavirus. Sju av virusen bar aminosyrasubstitutioner som tidigare visats minska känsligheten för oseltamivir eller zanamivir. Inga virus bar aminosyrasubstitutioner förknippade med minskad känslighet för baloxavir marboxil. Alla svenska influensa A-virus var resistenta mot amantadin. Sammanfattningsvis hade de svenska proven låga nivåer av resistens mot de för närvarande använda antivirala läkemedlen.
About this publication
This report describes the monitoring and surveillance systems for influenza in use during the 2025–2026 winter season and the results of both epidemiological and virological surveillance. Data are also compared to previous influenza seasons. See also the tables and figures section as well as the appendices.
The report was prepared for the World Health Organization (WHO) as part of the Public Health Agency of Sweden’s function as a National Influenza Centre (NIC).
Reports in English about the influenza seasons in Sweden are published annually. The most recent reports can be found on the Public Health Agency’s website (suggested search “Influenza in Sweden”) (1).
Public Health Agency of Sweden
Sara Byfors
Head of Department
Department of Microbiology
Erik Sturegård
Acting Head of Department
Department of Communicable Disease Control and Preparedness
Epidemiological data
Respiratory viruses overview in Sweden, 2025–2026
The 2025–2026 influenza season was characterised by an earlier start than the previous season, with an initial pattern more similar to the three preceding seasons. Influenza activity increased rapidly during December, peaked in early January, and was followed by a second peak in mid-February. Overall, 97 percent of laboratory-confirmed influenza cases were influenza A and 3 percent were influenza B. A small increase in influenza B/Victoria was seen towards the end of the season, with a low number of cases compared to previous B/Victoria epidemics.
The RSV season began later than usual and was less intense compared to the previous three seasons. During the season, all newborns were offered monoclonal antibodies against severe RSV infection, and a majority of parents accepted the offer. The number of reported cases, hospitalisations, and patients in intensive care among children under 6 months of age decreased significantly more than among older children, which is indicative of the effects of this initiative. Further epidemiological and microbiological analyses will be completed and published separately during 2026. The same intervention is planned for 2026–2027.
Transmission of COVID-19 was low throughout the autumn and winter with no distinct epidemic peak, and decreased further in the spring. The number of laboratory-confirmed cases, patients in intensive care, and deaths among COVID-19 cases in spring 2026 were the lowest since the pandemic started.
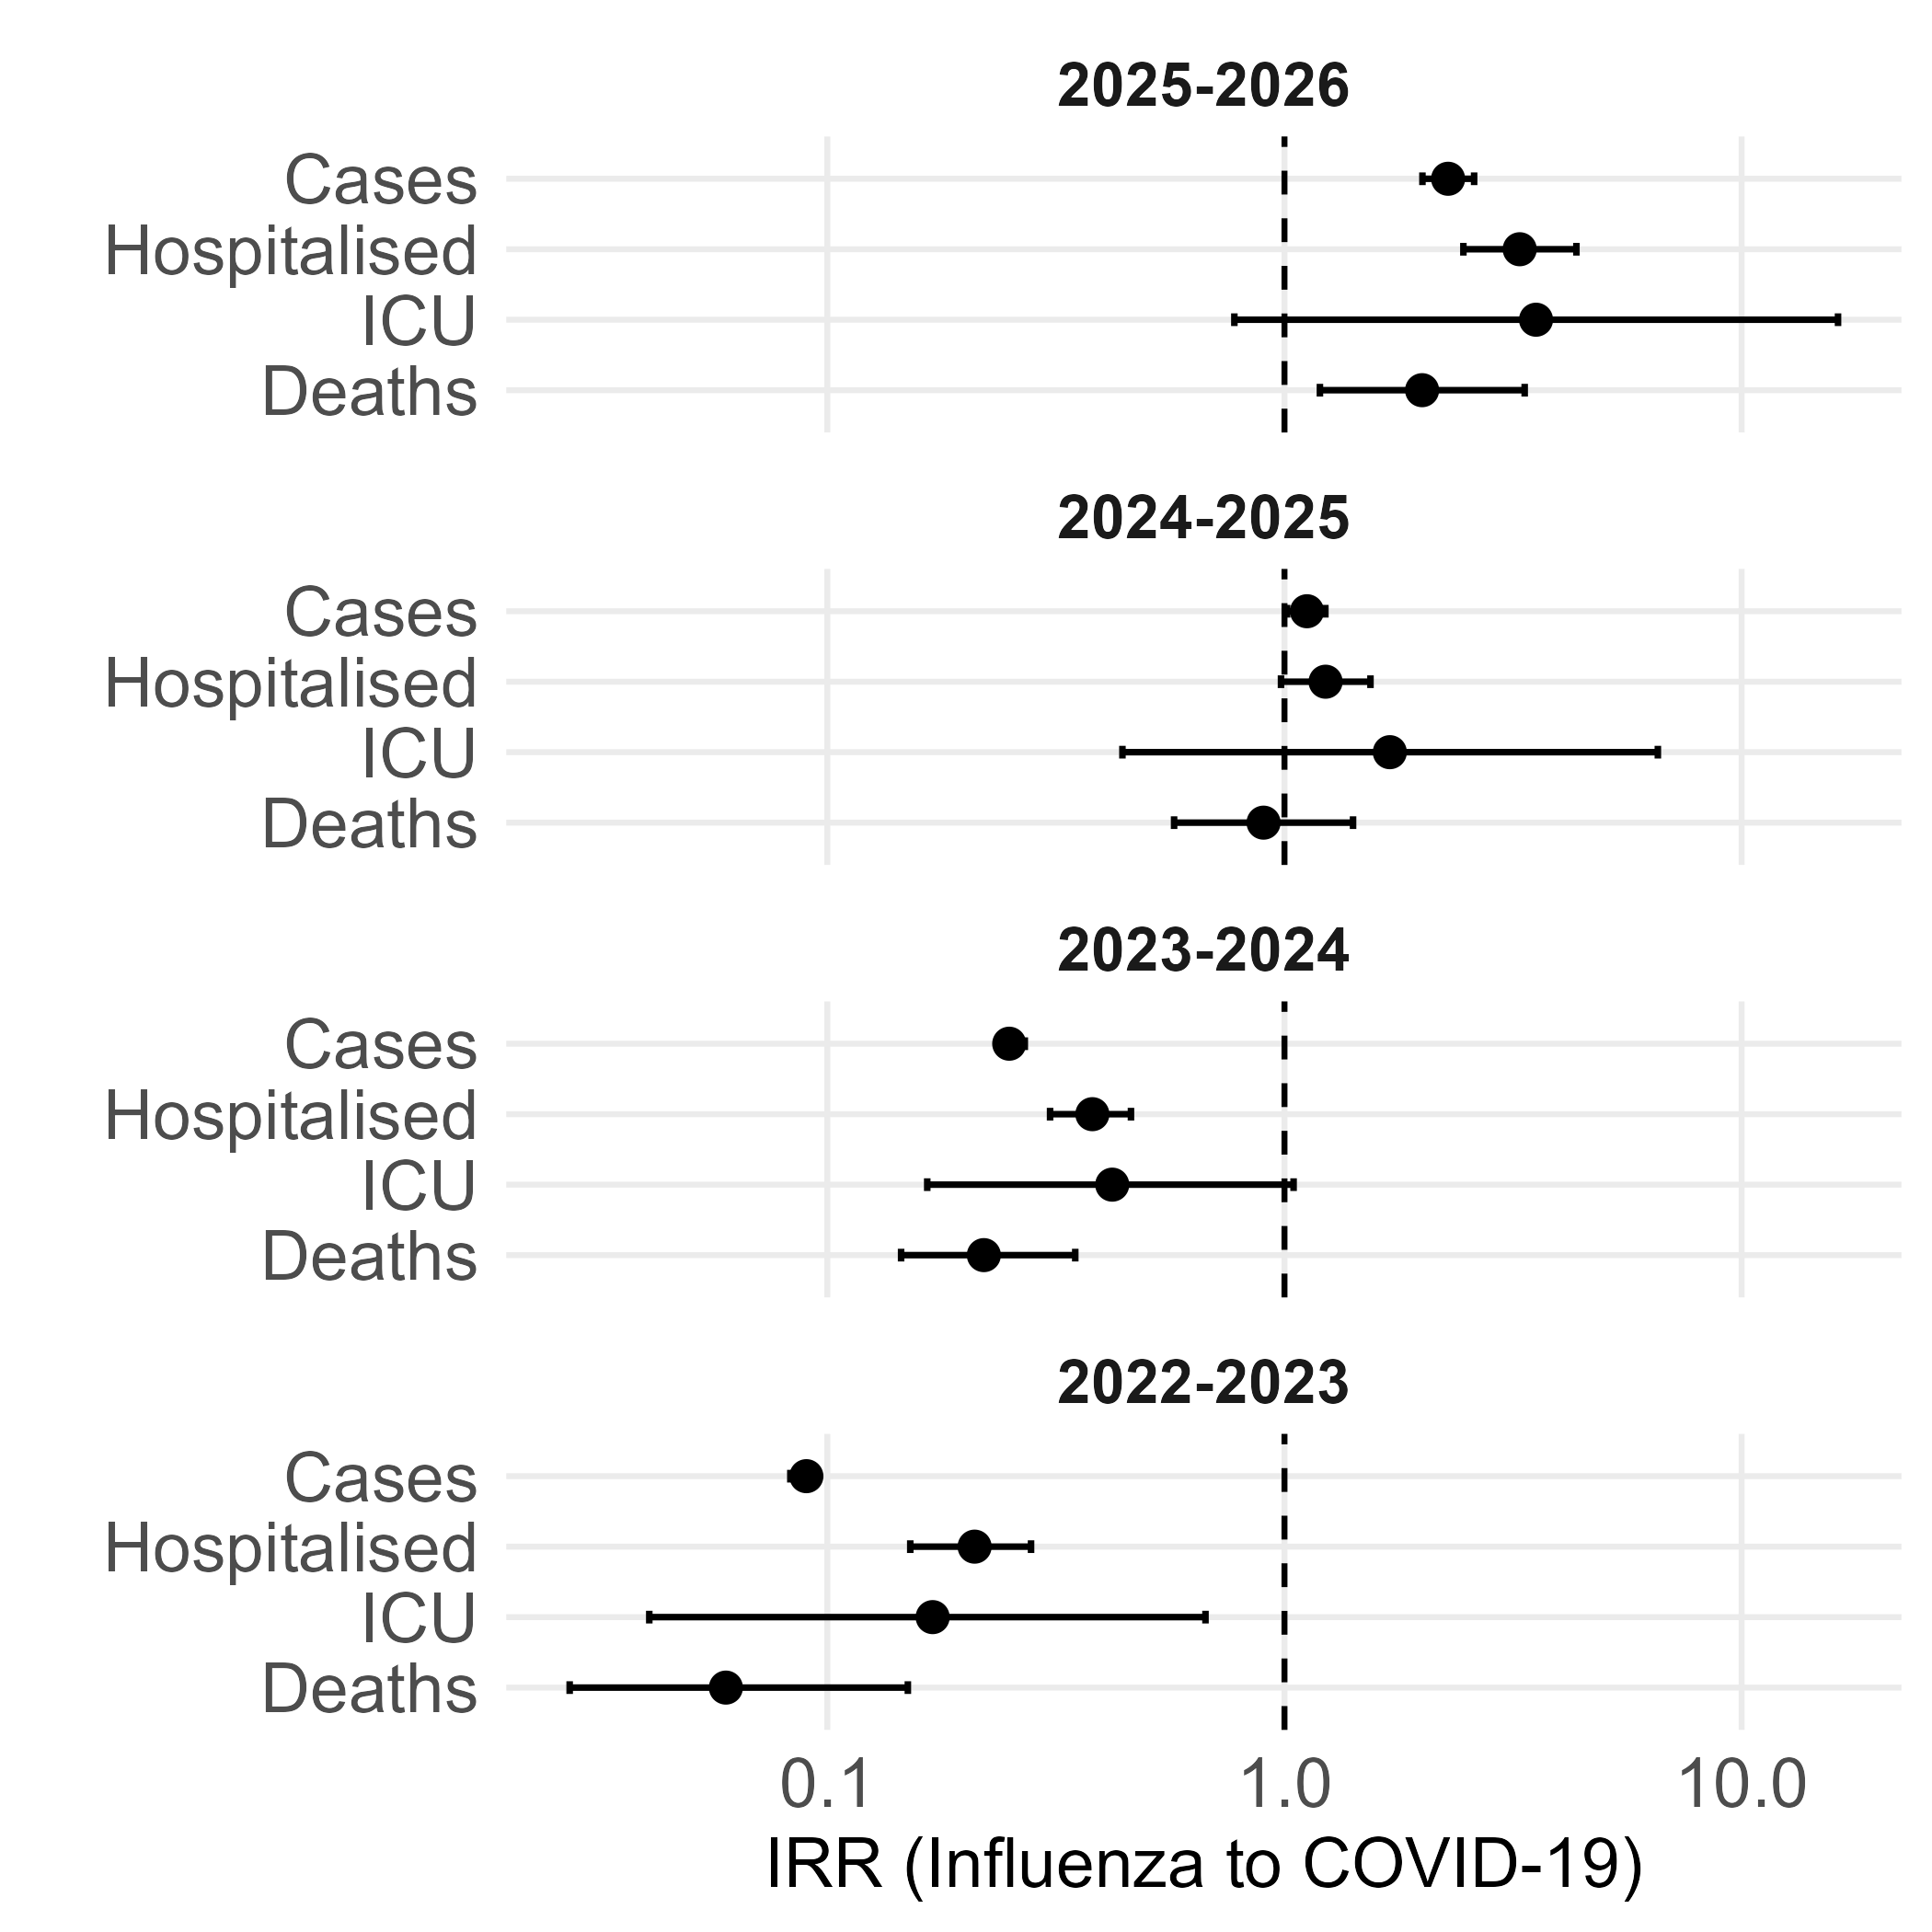
For the first time since 2020, influenza caused a higher burden of disease than COVID-19 in terms of laboratory-confirmed cases, hospitalisations, patients in intensive care, and deaths. Incidence rate ratios comparing each indicator for the age group 65 years and older clearly show the transition from COVID-dominance in the 2022–2023 and 2023–2024 seasons to influenza dominance in the 2025–2026 season.
Testing for influenza
For the 2025–2026 season, weekly data for influenza and RSV testing are based on reported SARS-CoV-2 testing because most samples are analysed simultaneously for these pathogens by multiplex-PCR systems. Testing volumes are influenced by the circulation of all three viruses, and during the 2025–2026 season influenza was the main driver of respiratory testing.
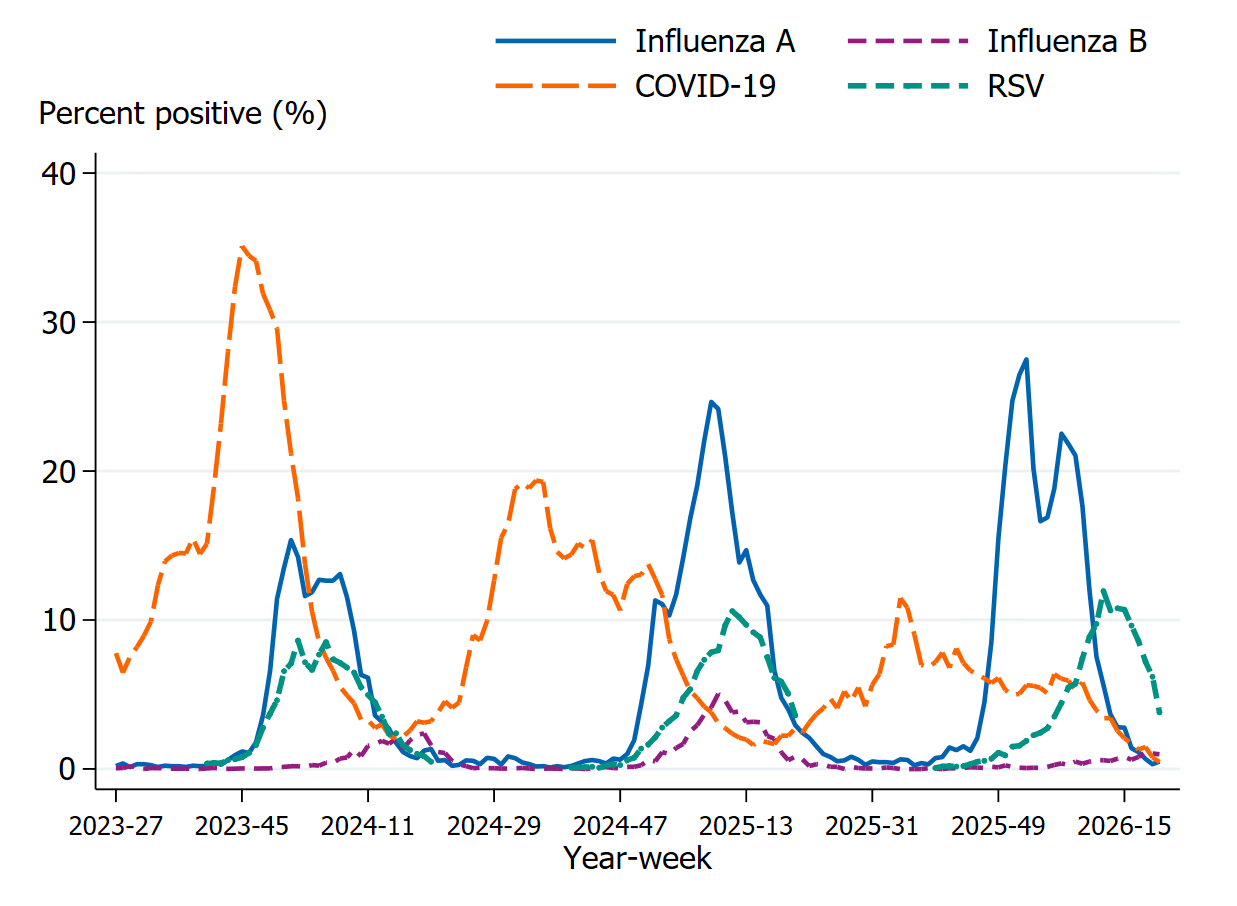
From week 40, 2025, to week 20, 2026, approximately 176,000 samples were analysed, which is lower than during the previous season (220,000). The highest weekly testing coincided with the peak of influenza activity. Overall, 12 percent of the samples tested during the season were positive for influenza, similar to the previous season (11 percent). Weekly positivity peaked at 26 percent in week 1 and remained high for several weeks, with a secondary peak of 21 percent in week 7.
Laboratory-confirmed influenza cases
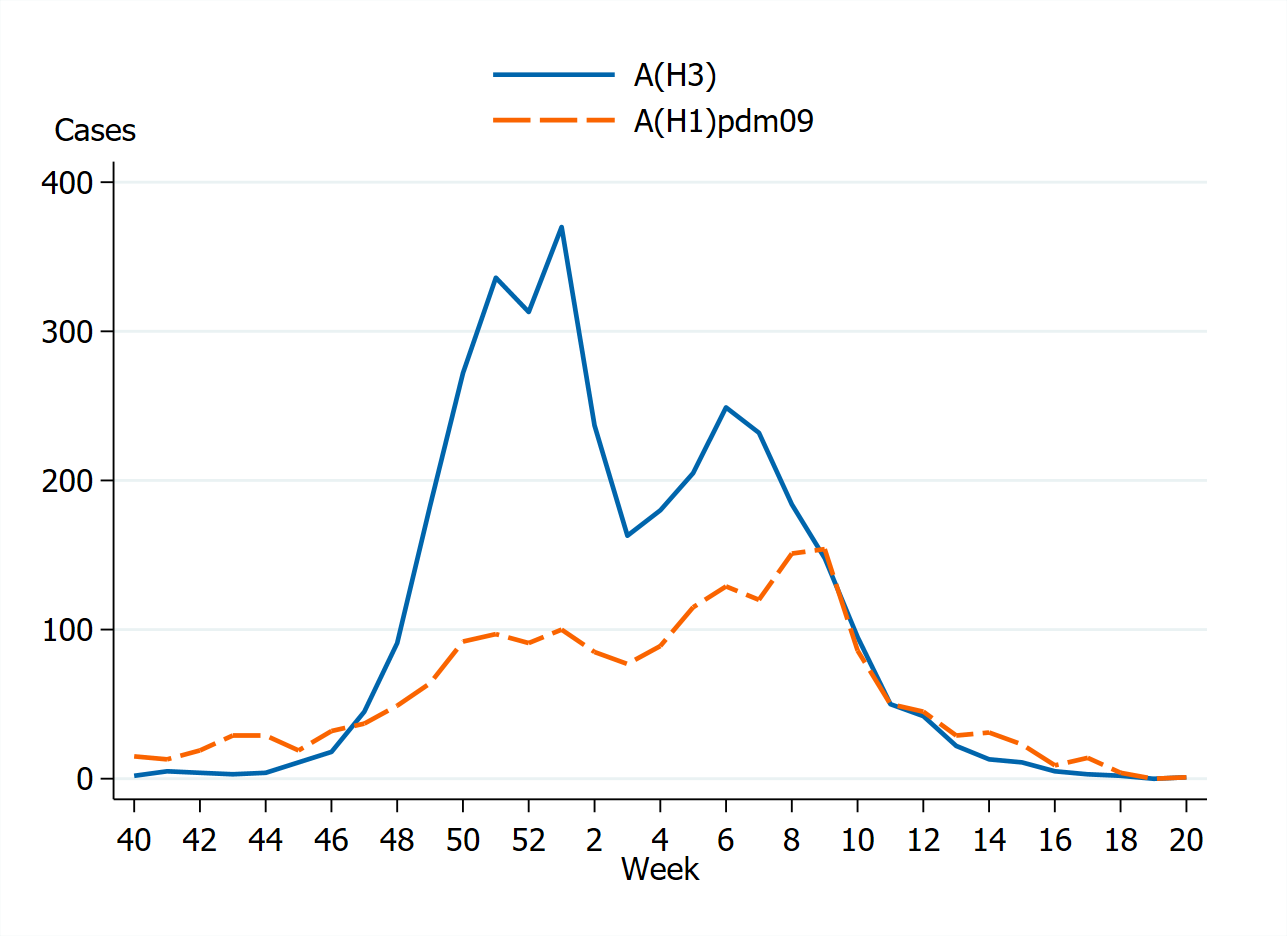
In total, 21,419 laboratory-confirmed influenza cases were reported during the 2025–2026 season (week 40, 2025 – week 20, 2026), of which 97 percent were influenza A and 3 percent were influenza B. Influenza A(H3) dominated among influenza A cases overall (64 percent), particularly during the first peak around weeks 51–1, while influenza A(H1)pdm09 increased later and contributed substantially to the second peak around weeks 6–8, see the section Subtyping and lineage determination.
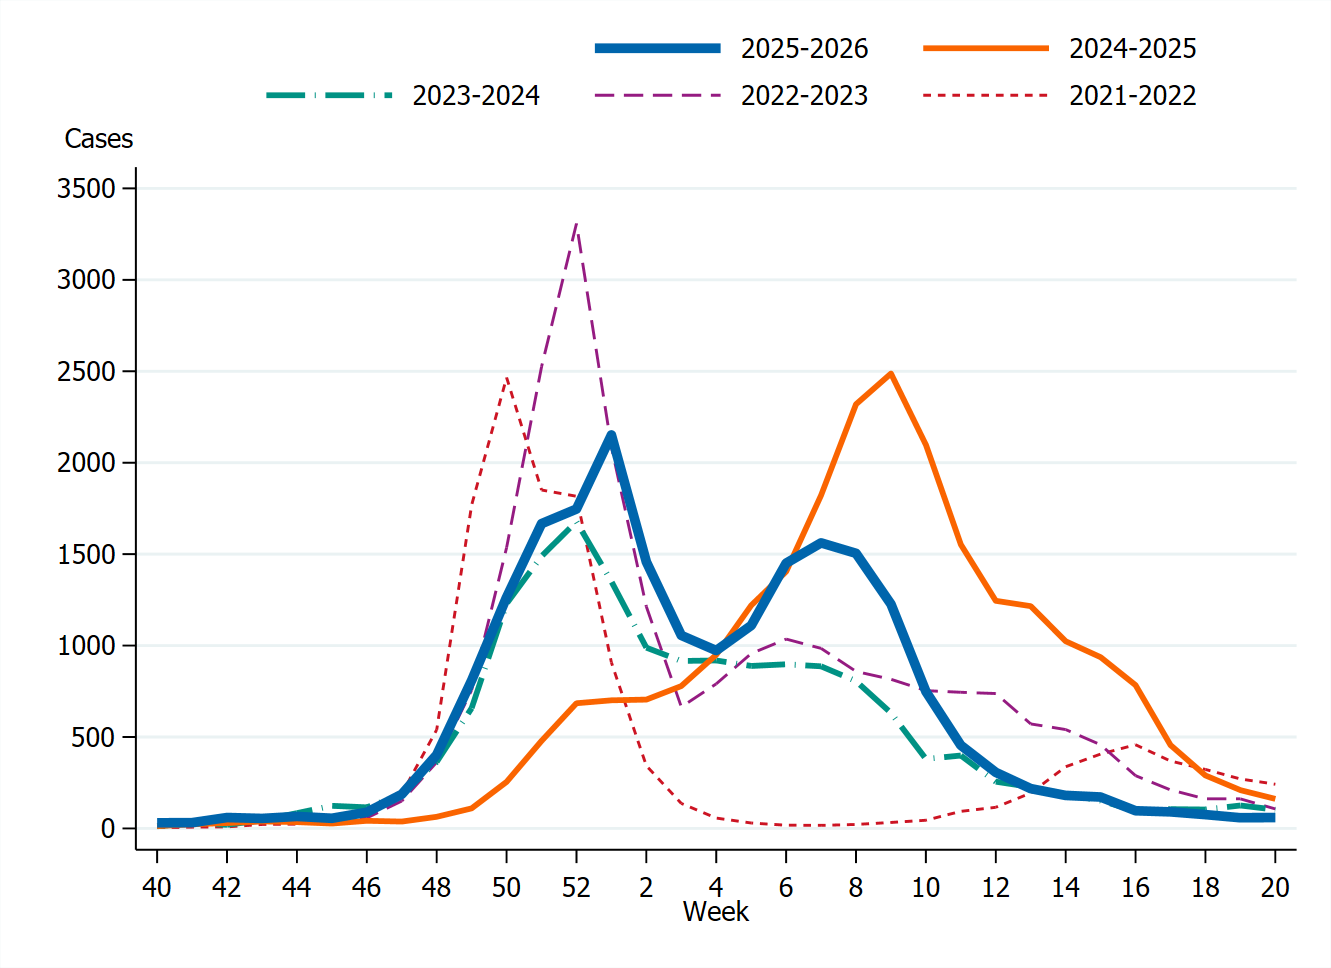
The epidemic started in week 47 based on the calculated epidemic threshold. The number of laboratory-confirmed influenza cases increased rapidly during December and reached its highest level in week 1, when approximately 2,200 cases were reported. After declining during January, a second, smaller peak occurred in week 7, with approximately 1,600 reported cases. The intensity reached a medium level during weeks 51–2 and 6–8 compared to previous seasons’ data. The epidemic started and peaked earlier than in the 2024–2025 season. In this sense it was more similar to the three preceding seasons, though it had a unique double peak. From week 8 onwards, the number of laboratory-confirmed influenza cases gradually decreased, and the epidemic of influenza A ended in week 13 at the national level.
A small increase in influenza B/Victoria was seen towards the end of the season. The number of cases was low, compared to previous B epidemics of the same lineage, and only a few severe cases were reported.
Intensity levels and epidemic thresholds for influenza and RSV for the 2025–2026 season were assessed based on a combination of seasons before and after the pandemic period (2024–2025, 2023–2024, 2022–2023, 2018–2019, and 2017–2018). This is in line with ECDC thresholds in the European Respiratory Virus Surveillance Summary (Erviss) (2).
Age and sex distribution of cases
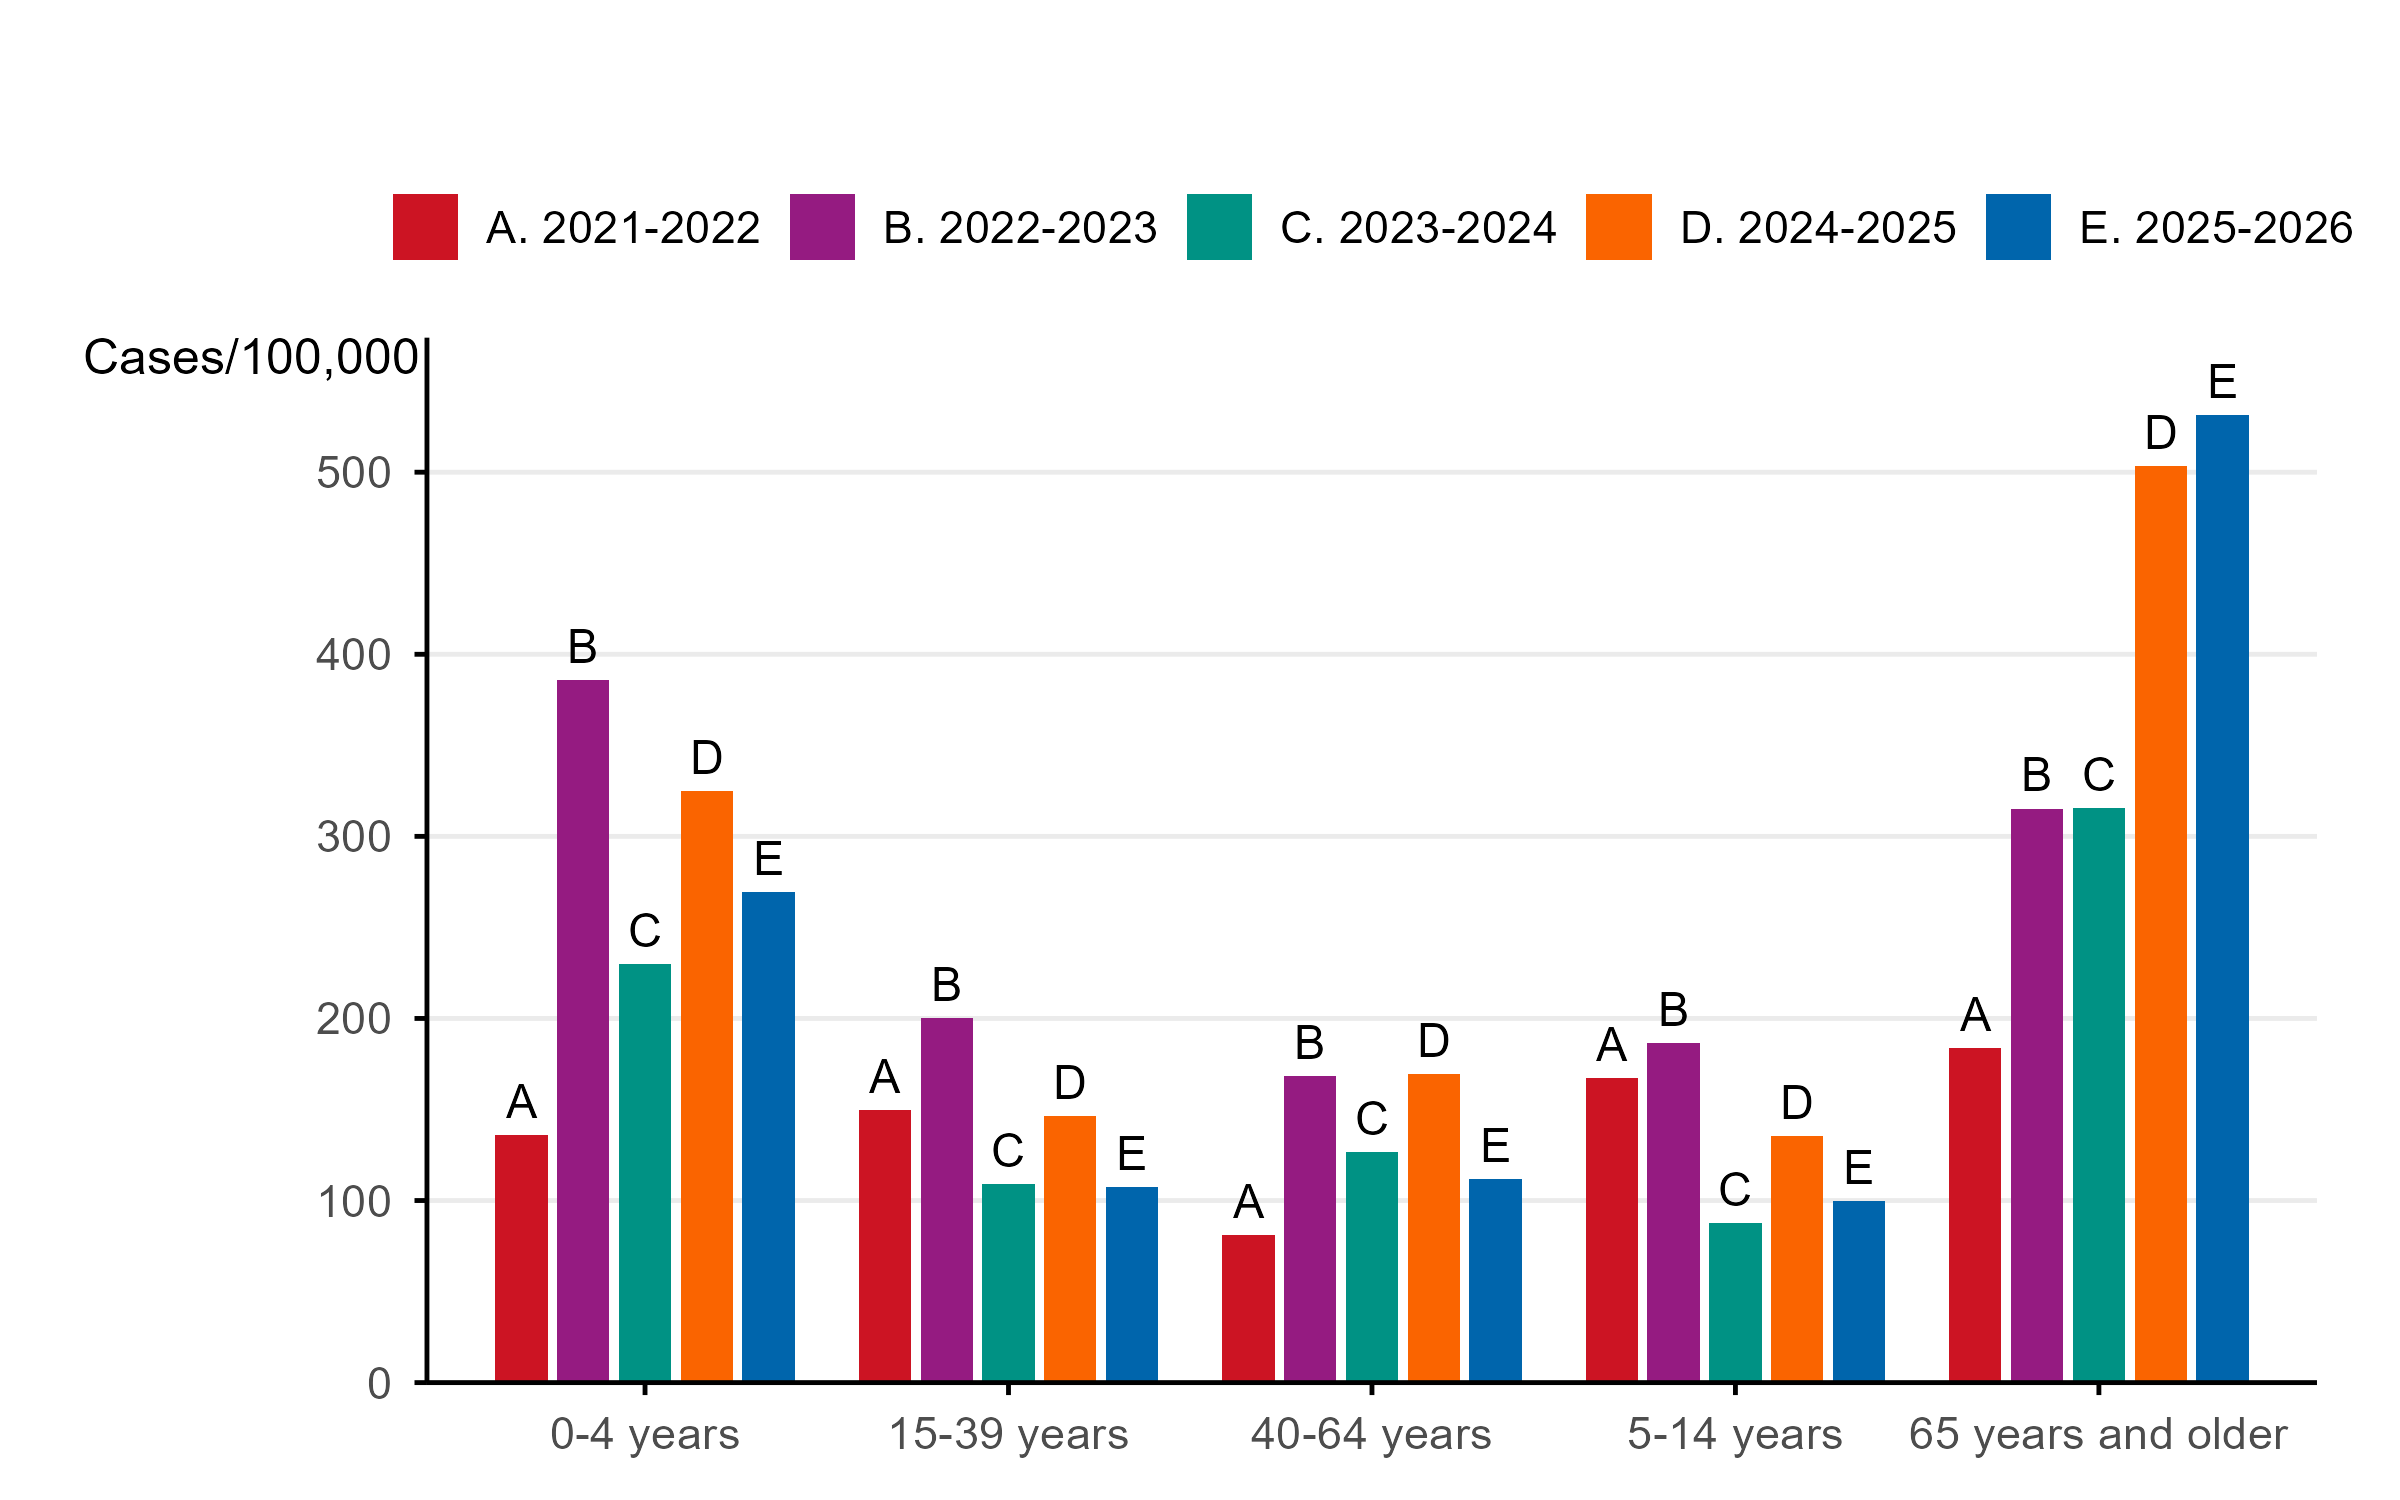
Compared with the previous season, the notification rate of laboratory-confirmed influenza (per 100,000 population) was lower in all age groups except among persons aged 65 years and older, where it increased slightly. Overall, the highest weekly and cumulative notification rate of laboratory-confirmed influenza was seen among persons aged 65 years and older, followed by children aged 0–4 years, which is the expected pattern. These age groups are typically most affected by severe illness in an influenza epidemic and are more often tested for influenza.
Because influenza B accounted for only 3 percent of all laboratory-confirmed influenza cases, the age distribution was largely driven by influenza A. The median age of reported cases of influenza A and B was 70 and 30 years, respectively. Slightly more women (54 percent) than men had laboratory-confirmed influenza.
Geographic distribution of cases
The epidemic started slightly later in the south (Götaland) than in central (Svealand) and northern (Norrland) Sweden. During the first peak, around week 1, notification rates (per 100,000 population) were highest in Norrland, followed by Svealand, while Götaland had a lower peak. A second peak occurred in all three parts of Sweden, with Norrland again reporting the highest notification rates. In contrast to Svealand and Norrland, where the second peak was lower than the first, Götaland experienced two peaks of similar magnitude. Overall, the cumulative notification rate for the season was highest in Norrland (266 per 100,000 population), followed by Svealand (215) and Götaland (179).
Hospitalised influenza cases
A total of 8,391 hospitalised patients with laboratory-confirmed influenza and a primary hospital diagnosis of influenza or pneumonia were reported during the season, of whom 8,244 had influenza A (98 percent). Among the influenza A cases that were subtyped (27 percent, n = 2,224), 63 percent were influenza A(H3) and 37 percent were influenza A(H1)pdm09. Eleven cases were subtyped as both A(H1)pdm09 and A(H3).
Similar to cases, hospitalisations also had two peaks. The total number of hospitalised patients was comparable to the previous season (8,577) but higher than other previous seasons since the COVID-19 pandemic, likely partly due to the double peak.
The median age of hospitalised patients with influenza was 76 years, and 50 percent were men. The highest incidence of hospitalised cases per 100,000 population was observed among persons aged 65 years or older followed by children aged 0–4 years.
Influenza cases in intensive care
A total of 317 patients in intensive care with laboratory-confirmed influenza were reported between week 40, 2025, and week 15, 2026, at which point data updates were paused. Data for the season are therefore likely to be somewhat incomplete. The total number of patients was similar to the past three seasons.
In total, 99 percent of intensive care influenza patients had influenza A (313 patients). Among the 123 influenza A samples that were subtyped, 51 percent were influenza A(H3) and 46 percent were influenza A(H1)pdm09. Three cases were subtyped as both A(H1)pdm09 and A(H3). Compared to cases and hospitalisation, the distribution between subtypes among cases in intensive care was more even, which likely reflects differences by subtype in terms of typical age and severity of infection, where A(H1)pdm09 is more likely to cause severe infections among younger adults who are more likely to be treated in intensive care.
The median age of patients with influenza admitted to intensive care during the 2025–2026 season was 66 years, and the sex distribution was even (51 percent were men). Similar to other seasons, the highest incidence of intensive care admissions per 100,000 population was observed among persons aged 65 years or older, followed by those aged 40–64 years and children aged 0–4 years. Incidence per age group was generally similar to previous seasons, but was slightly higher in the oldest age group.
Among all patients, 79 percent belonged to a risk group for severe disease due to age (65 year or older) or underlying medical conditions. The most common conditions were chronic lung disease, diabetes, and chronic heart disease. Among patients under 65 years of age, 55 percent belonged to a risk group due to underlying medical conditions. Four patients were pregnant. There were 34 patients under the age of 18, of whom 24 percent belonged to a risk group for severe disease.
Influenza-related mortality
A total of 1,070 confirmed cases were reported to have died within 30 days of influenza diagnosis, of which more than 99 percent had influenza A. Among the 246 influenza A samples that were subtyped from patients who died, 52 percent were influenza A(H3) and 47 percent were influenza A(H1)pdm09. Two deaths were diagnosed with both subtypes. Data are insufficient to draw conclusions about the distribution of subtypes, because only a fourth of deaths had subtyped samples and there may be a bias in terms of which samples are selected for subtyping.
Similar to cases, the pattern of deaths also showed two peaks, with the highest weekly number of deaths in week 2, 2026, with over 100 deaths per week, followed by a second peak in week 9 at 96 deaths. The total number of deaths and the peak number of deaths was high, similar to the 2024–2025 season. Both seasons had considerably more recorded deaths than the previous five seasons. This may reflect both the severity of the dominating A(H3) subtype and increased testing in older age groups.
The median age of those who died in the 2025–2026 season was 85 years, and 95 percent were 65 years or older. Among all influenza cases, 5 percent died within 30 days of diagnosis. Among persons aged 65 years and older with laboratory-confirmed influenza A, approximately 9 percent died within 30 days. Of those who died, approximately 30 percent lived in long-term care facilities, while 44 percent had home-care services (hemtjänst). The sex distribution of deaths was even.
The PHAS monitors all-cause excess mortality nationally, per age group, and by region through the EuroMOMO model (3). This model showed excess mortality at the national level in week 1, 2026, during the first seasonal peak. Weekly mortality was just over the upper boundary for the expected normal variation, despite the relatively high number of cases who died within 30 days of diagnosis.
Sentinel surveillance
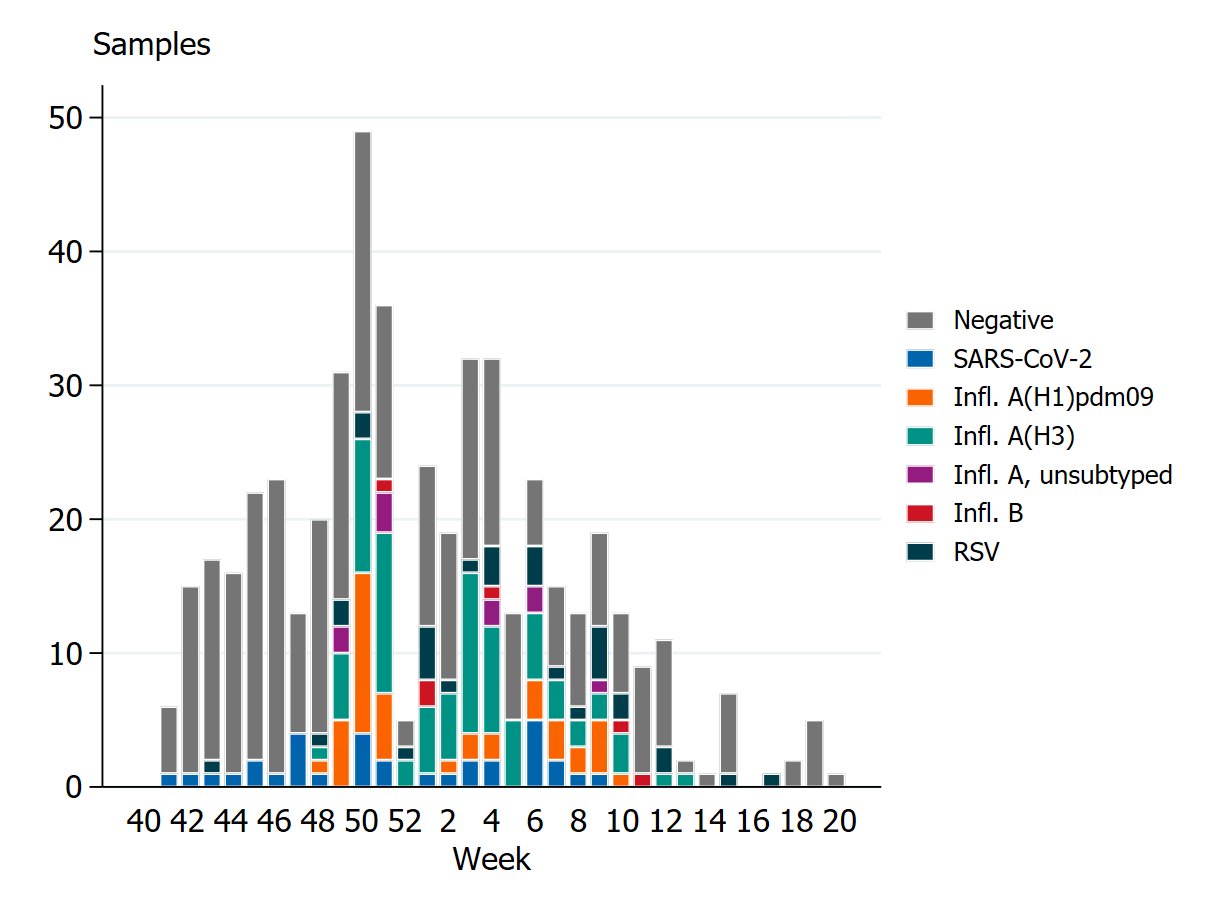
In the 2025–2026 season, 37 general practitioner sites participated in sentinel surveillance. In total, 138 of 490 sentinel samples were positive for influenza (28 percent). Of these, 132 were influenza A (96 percent) and the remaining six were influenza B/Victoria (4 percent). Of the influenza A positives, 67 percent were influenza A(H3) and 33 percent were influenza A(H1)pdm09. A few influenza A-positive samples were not subtyped due to low viral load. One coinfection of influenza A and RSV-A was detected, two coinfections of influenza A and RSV-B were detected, and one coinfection of influenza A and SARS-CoV-2 was detected.
According to laboratory-based surveillance, the onset of the influenza epidemic was identified in week 47, with sentinel surveillance showing comparable patterns. The number of sampled patients within sentinel surveillance was relatively stable from weeks 42 to 49, and this was followed by a period of increased week-to-week fluctuation as the season progressed. The most significant peak in sampling occurred in week 50, coinciding with the highest number of influenza-positive samples recorded. Influenza A dominated the season and accounted for a majority of the positive samples during the highest activity periods, while influenza B was detected sporadically at low levels. SARS-CoV-2 was detected at low levels (zero to five positives per week) throughout the season until early March, and no distinct peak was observed. RSV was detected throughout the surveillance period from week 48, with zero to four positives per week. The majority of patients sampled within the sentinel system were adults (age median 50, Table 9). The total cumulative positivity for the period from week 40, 2025, to week 20, 2026, when testing for influenza, RSV, and SARS-CoV-2 viruses was 42 percent.
Among the 490 patients sampled, 79 percent exhibited influenza-like illness (ILI), while 21 percent had acute respiratory illness (ARI). During the season as a whole, 23 percent of sentinel samples were obtained from patients aged 65 years or older. Among the 104 sampled patients in this age group for whom vaccination status was reported, 60 percent had received influenza vaccination.
Data collected from the sentinel program in Sweden contributes to vaccine effectiveness studies for influenza and COVID-19 at the European level, coordinated by the VEBIS network (Vaccine Effectiveness, Burden and Impact Studies) (4, 5).
Influenza and COVID-19 vaccination
Vaccination campaigns against seasonal influenza and COVID-19 began on October 15, 2025 (week 42). Mainly trivalent standard-dose influenza vaccines were used for the general population, while adjuvanted influenza vaccines were used in long-term care facilities for the elderly. For COVID-19, mRNA vaccines were primarily used. For individuals recommended only the influenza vaccine, vaccinations began during week 45 (early November).
As of autumn 2025, COVID-19 vaccination recommendations differed from the previous season and individuals not belonging to a medical risk group were recommended vaccination starting at age 75 rather than age 65 as previously recommended. Consequently, fewer people in the 65 year and older were eligible for both vaccines.
Influenza vaccination coverage among persons aged 65 years and above was estimated at 68 percent, which was approximately as high as in the previous two seasons and the 2021–2022 seasons, during which concomitant vaccinations were offered. The vaccination coverage was considerably higher than in the seasons prior to the COVID-19 pandemic. Influenza vaccination coverage was highest among people aged 80 years and above at 79 percent, followed by those aged 65–79 years at 60 percent.
Estimating vaccination coverage among medical risk groups under 65 years of age is difficult because risk group status is challenging to define and is not usually collected. In addition, influenza vaccinations are not included in the national vaccination register. Based on the available data, coverage among people under 65 years of age was approximately 4 percent, which was similar to previous seasons.
Previous analyses show that simultaneous vaccination against influenza and COVID-19 contributes to increased vaccination coverage. Results from this season indicate that coordinated vaccination played a significant role in maintaining high coverage for both influenza and COVID-19, with a COVID-19 vaccination coverage of approximately 74 percent for those aged 75 or older. In addition, the attention given to the emergence of the new K variant of influenza A(H3N2) in the autumn of 2025 may have boosted interest in vaccination, thus contributing to high coverage for both influenza and COVID-19.
The PHAS annual analysis of burden of severe disease from COVID-19 and influenza amongst people aged 65 years or older after the 2025–2026 season showed that influenza had a higher disease burden than COVID-19 in this age group in terms of severe disease. Based on the available data, the PHAS has concluded that a combined vaccination programme continues to be the appropriate approach to protect groups that have been recommended to recieve vaccination for the coming season. As a result, the vaccination start date was chosen for best coverage during the expected peak of influenza transmission, with the vaccination campaign starting in the first week of November 2026 (week 45) for all groups recommended both vaccinations.
The option for the elderly to receive a booster dose for COVID-19 during the spring was removed after the 2025 spring dose. Apart from this, all recommended groups remain the same for the 2026–2027 season as for the previous season.
Virus characterisation
Subtyping and lineage determination
All diagnostic laboratories perform influenza typing using molecular assays for influenza A and B, and some perform subtyping of influenza A. The PHAS performs subtyping and lineage typing by real-time PCR for all samples received from the Swedish clinical microbiological laboratories and on all positive samples from sentinel surveillance as part of the national microbiological surveillance program.
In total, 5,552 influenza A-positive samples from laboratories in Sweden were subtyped during the season, comprising approximately 27 percent of all laboratory-confirmed cases of influenza A. Of the subtyped samples, 3,581 (65 percent) were A(H3) and 1,942 (35 percent) were A(H1)pdm09. Twenty-nine subtyped samples were reported as both influenza A(H3) and A(H1)pdm09, indicating co-infections.
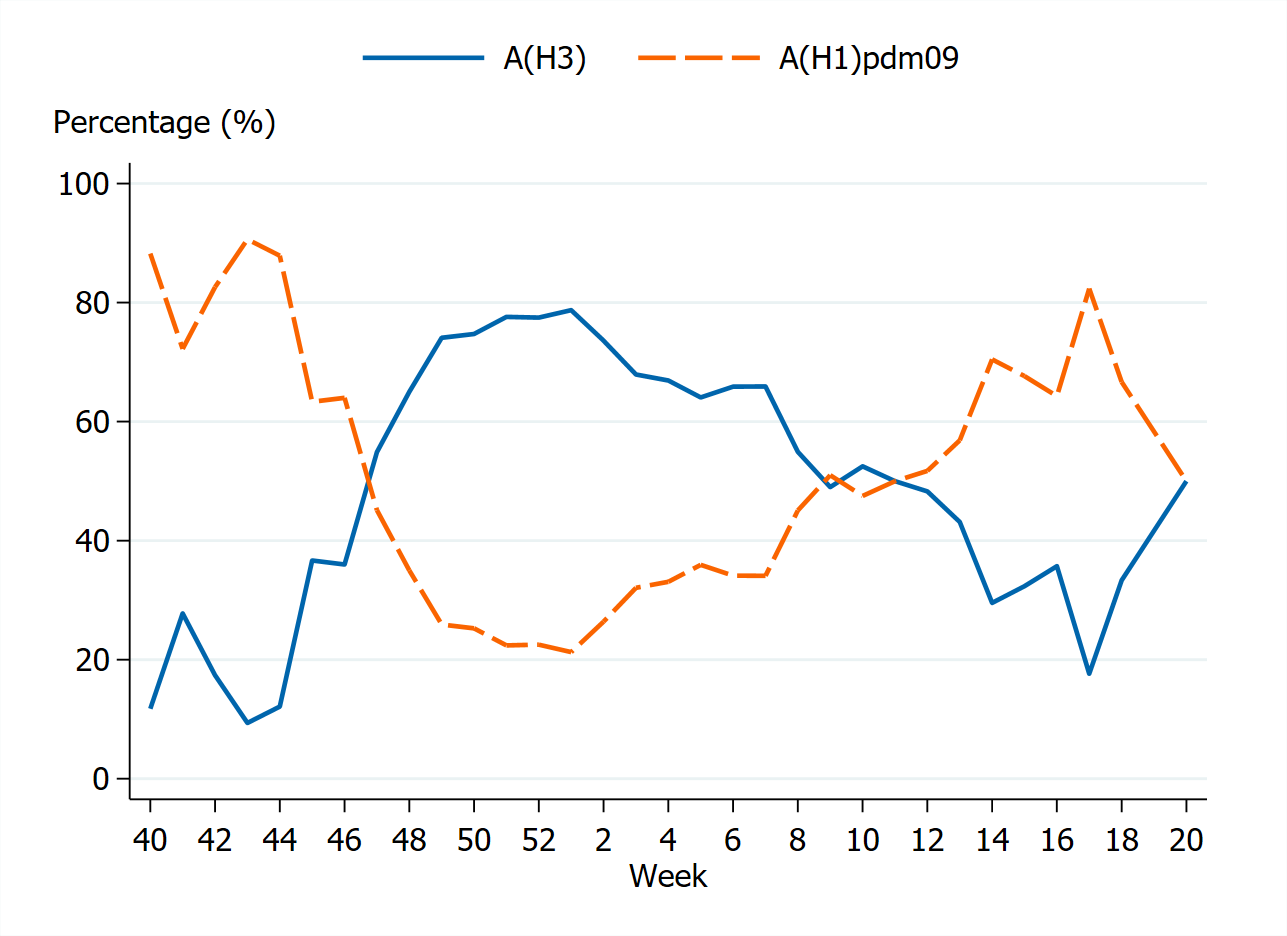
Subtype A(H3) dominated early in the season, particularly during the first peak in weeks 51–1, while influenza A(H1)pdm09 increased later and contributed substantially to the second peak in weeks 6–8. From week 9 onwards, the distribution of the two influenza A subtypes was relatively even. In the sentinel surveillance in primary care, 122 influenza A-positive samples were subtyped. Of these, 67 percent were A(H3) and 33 percent were A(H1)pdm09. One sample was positive for both A(H3) and A(H1)pdm09.
The lineage was determined for 155 out of the 601 influenza B-positive samples in laboratory reporting (26 percent), and all belonged to the B/Victoria lineage. The subtype and lineage of influenza-positive samples from sentinel and laboratory reporting systems are presented in the tables and figures section of this report.
Since 2024, increased subtyping of out-of-season influenza A cases has been conducted during summers, in accordance with recommendations from the ECDC for surveillance of zoonotic influenza. No zoonotic origin strains, including A(H5), have yet been detected.
Genotypic characterisation
A selection of influenza-positive samples, collected from both clinical microbiology laboratories and sentinel surveillance, underwent genetic characterisation through whole genome sequencing (WGS) on an Ion Torrent platform as part of Sweden’s national microbiological surveillance program. The samples were chosen for broad representativeness in terms of geographic origin, collection period, and virus type/subtype/lineage. Swedish laboratories were also asked to submit influenza-positive samples to the PHAS from patients with severe or fatal outcomes, vaccine breakthrough infections, or cases unresponsive to antiviral treatment. These samples were further characterised, provided that the viral load was sufficient. Genetic characterisation and virus isolation were typically successful for samples with a real-time PCR Ct-value of 30 or lower.
The hemagglutinin (HA) gene was analysed in detail and assigned to genetic groups according to the ECDC’s influenza characterisation guidelines. The neuraminidase (NA) gene was analysed for amino acid substitutions previously linked to reduced or highly reduced inhibition by the NA inhibitors oseltamivir and zanamivir. The polymerase acidic (PA) gene was screened for substitutions associated with a more than 3-fold increase in IC50 for baloxavir marboxil. The matrix gene of influenza A viruses was analysed for substitutions previously associated with resistance to amantadine. Additionally, the regions of the matrix and HA genes targeted by the specific real-time PCR systems used at the PHAS were examined for sequence mismatches compared to the primers and probes in these systems.
A representative selection of isolated virus samples was sent to the World Health Organization Collaborating Centre (WHOCC) in London for antigenic characterisation and phenotypic analysis of susceptibility to NA inhibitors using the NA inhibition assay.
Characterisation data were continuously reported to the ECDC via The European Surveillance System (TESSy), and sequence data were regularly uploaded to the Global Initiative on Sharing All Influenza Data (GISAID).
Genetic groups
Clades and subclades of 252 characterised Swedish influenza A and B viruses from the 2025–2026 season are presented in Tables 1, 2, and 3 by influenza subtype or lineage and in the phylogenetic trees in Appendices 1–3. Of the characterised viruses, 89 were subtype A(H1N1)pdm09, 116 were subtype A(H3N2), and 47 were lineage type B/Victoria.
No antigenic analyses were performed at the PHAS. The general antigenic properties of the genetic groups have, however, been summarised in the report by the WHO in conjunction with the influenza vaccine composition recommendation meeting for the Northern Hemisphere 2026–2027 season held in February 2026 (7).
Influenza A(H1N1)pdm09
Of the characterised Swedish influenza A(H1N1)pdm09 viruses, 88 belonged to clade 5a.2a.1, subclade D.3.1, represented by A/Missouri/11/2025, and one virus belonged to clade 5a.2a, subclade C.1.9.3, represented by A/Hungary/286/2024 (see Appendix 1). Subclade D.3.1 has further diversified into subclade D.3.1.1, see Appendix 1. Subclade D.3.1 is the dominant subclade within European surveillance as well as globally ( 6, 7). Human serological studies have shown a possible lack of protection against subclades D.3.1 and D.3.1.1 for the 2025–2026 Northern Hemisphere seasonal influenza vaccine, and the vaccine strain has been changed for the upcoming 2026–2027 Northern Hemisphere influenza season to A/Missouri/11/2025 (subclade D.3.1).
| Genetic group (Subclade) | Representative strain | Number of viruses (Percentage of viruses) |
|---|---|---|
| 5a.2a (C.1) | A/Netherlands/10468/2023 | 0 (0 %) |
| 5a.2a (C.1.9) | A/Lisboa/188/2023 | 0 (0 %) |
| 5a.2a (C.1.9.3) | A/Hungary/286/2024 | 1 (1 %) |
| 5a.2a.1 (D) | A/Victoria/4897/2022 | 0 (0 %) |
| 5a.2a.1 (D.3.1) | A/Missouri/11/2025 | 88 (99 %) |
Influenza A(H3N2)
All Swedish A(H3N2) viruses characterised for the HA gene belonged to clade 2a.3a.1, with subclade K being the predominant group, in line with global and European data for the same period. Of the 116 analysed viruses, one virus belonged to subclade J.2.2, represented by A/Lisboa/216/2023; 17 belonged to J.2.4, represented by A/Singapore/GP20238/2024; one belonged to subclade J.2.5, represented by A/Victoria/211/2025; and 97 belonged to subclade K (J.2.4.1), represented by A/Norway/8765/2025 (see Appendix 2). Vaccine effectiveness studies for the Northern Hemisphere during the 2025–2026 season have shown moderate protection against A(H3N2), at levels comparable to the 2024–2025 season. For the 2026–2027 Northern Hemisphere influenza season, a vaccine strain within subclade K is recommended for A(H3N2).
| Genetic group (Subclade) | Representative strain | Number of viruses (Percentage of viruses) |
|---|---|---|
| 2a.3a.1 (J) | A/Thailand/8/2022 | 0 (0 %) |
| 2a.3a.1 (J.2) | A/Croatia/10136RV/2023 | 0 (0 %) |
| 2a.3a.1 (J.2.1) | A/Switzerland/59652/2024 | 0 (0 %) |
| 2a.3a.1 (J.2.2) | A/Lisboa/216/2023 | 1 (1 %) |
| 2a.3a.1 (J.2.3) | A/Netherlands/10685/2024 | 0 (0 %) |
| 2a.3a.1 (J.2.4) | A/Singapore/GP20238/2024 | 17 (15 %) |
| 2a.3a.1 (J.2.4.1) (K) | A/Norway/8765/2025 | 97 (84 %) |
| 2a.3a.1 (J.2.5) | A/Victoria/211/2025 | 1 (1 %) |
Influenza B/Victoria
All of the 47 B/Victoria viruses characterised in Sweden this season belonged to clade V1A.3a.2 (C), represented by B/Austria/1359417/2021 (see Appendix 3). Eleven of the characterised viruses belonged to subclade C.5.6.1, represented by B/ENG/120/2025; 26 viruses belonged to subclade C.5.6, represented by B/Switzerland/329/2024; one virus belonged to subclade C.5.1, represented by B/Catalonia/2279261NS/2023; and nine viruses belonged to subclade C.5.7, represented by B/Greece/5509/2024 (see Table 1). These are all subclades that have circulated globally, each with varying geographic spread. None of the viruses characterised in Sweden during the 2025–2026 season belonged to subclade C.3.1, a subclade that is currently circulating in the Americas and in some other regions globally, and to which the recommended vaccine strain for the 2026–2027 season belongs. In serological analysis, antisera raised against viruses from subclade C.3.1 demonstrated broad cross-reactivity, recognizing subclades within C.5.
| Genetic group (Subclade) | Representative strain | Number of viruses (Percentage of viruses) |
|---|---|---|
| V1A.3a.2 (C) | B/Austria/1359417/2021 | 0 (0 %) |
| V1A.3a.2 (C.3.1) | B/Kanagawa/AC2414/2025 | 0 (0 %) |
| V1A.3a.2 (C.5) | B/Stockholm/3/2022 | 0 (0 %) |
| V1A.3a.2 (C.5.1) | B/Catalonia/2279261NS/2023 | 1 (2 %) |
| V1A.3a.2 (C.5.6) | B/Switzerland/329/2024 | 26 (55 %) |
| V1A.3a.2 (C.5.6.1) | B/ENG/120/2025 | 11 (23 %) |
| V1A.3a.2 (C.5.7) | B/Greece/5509/2024 | 9 (19 %) |
Influenza B/Yamagata
No B/Yamagata strains were confirmed among positive influenza samples in Sweden or globally during the 2025–2026 season. Influenza B/Yamagata circulation has not been detected globally since 2020.
Antiviral susceptibility
The NA gene of 118 influenza A(H3N2), 87 influenza A(H1N1)pdm09, and 46 influenza B/Victoria viruses was sequenced and analysed for amino acid substitutions previously shown to be associated with reduced or highly reduced inhibition by the NA inhibitors oseltamivir and zanamivir. All but seven viruses were genotypically sensitive to these antiviral drugs. Four influenza A(H3N2) viruses carried the S331R substitution, which has shown normal to reduced sensitivity (NI/RI) to neuraminidase inhibitors. Three influenza A(H1N1)pdm09 viruses carried the double mutation I223V + S247N, which are associated with reduced sensitivity (RI) to oseltamivir. Additional phenotypic results are pending from the WHOCC.
In total, the PA gene was sequenced and analysed for 113 influenza A(H3N2), 81 A(H1N1)pdm09, and 46 B/Victoria viruses. No amino acid substitutions associated with reduced inhibition by baloxavir marboxil were found.
The amino acid substitution S31N in the matrix protein, which confers resistance to amantadine, was present in all 220 Swedish influenza A-viruses (126 A(H3N2) and 94 A(H1N1)pdm09 viruses).
Virus isolation in cell culture
A subset of previously sequenced samples was chosen for isolation in MDCK-SIAT1 cells. Sample selection was based on similar criteria as for genetic characterisation, as described earlier. Inactivated samples and samples with low viral load (Ct-value more than 30) were not included. A total of 49 viruses (23 A(H3N2), 19 A(H1N1)pdm09, and 7 B/Victoria viruses) were successfully isolated in MDCK-SIAT1 cells. Of these, 49 virus isolates along with 46 matching clinical samples were sent to the WHOCC in London for further characterisation, and the results are pending.
Quality assessment
External quality assessment programmes provide a comparison of method performance between laboratories and serve as a tool to ensure the accuracy of laboratory testing. The PHAS takes part in several external programmes and produces a panel for other Swedish laboratories. Surveillance is dependent on such standardised methods.
At the PHAS, one-step real-time RT-PCR assays are employed to detect influenza A and B, to subtype influenza A-positive samples, and to discriminate between the two influenza B lineages. These assays have also been optimised, implemented, and evaluated for avian influenza diagnostics. The importance of these assays lies in their sensitivity, rapidity, and scalability. The PHAS continuously monitors the genomic sequences of circulating influenza strains in order to detect mutations that might impact the sensitivity of the PCR assays. The PHAS also performs in silico (computational) validation of each assay annually before the peak of the influenza season.
Annually, in early autumn prior to the onset of the influenza season, the Public Health Agency of Sweden (PHAS) produces a PCR panel for Swedish laboratories on behalf of the External Quality Assessment for Clinical Laboratory Investigations (EQUALIS). This allows laboratories to measure the analytical sensitivity and specificity of their methods. The majority of the laboratories performing diagnostics for influenza use commercial PCR kits. A number of these laboratories participate in additional quality controls during the season in order to ensure that circulating influenza strains can be detected with these kits.
In addition to the annual panel, the PHAS may distribute supplementary panel samples as needed. This could be in response to rapidly evolving circulating strains or to assess the ability of commercial kits to detect influenza A of zoonotic origin. During early spring of 2026, a panel containing inactivated and diluted isolates of influenza viruses was distributed to selected laboratories. The panel included the newly emerged A(H3N2) subclade K virus as well as a zoonotic strain of avian influenza A(H5N1). The results showed that the 11 evaluated commercial kits performed well for the genetic groups of human seasonal influenza that circulated predominantly during the 2025–2026 season in Sweden. Additionally, the kits were able to detect influenza A in the sample containing an inactivated avian influenza A(H5N1) virus.
National quality assessment programme for influenza PCR
In September 2025, the PHAS produced a PCR panel for Swedish laboratories, which was distributed by EQUALIS. Twenty laboratories participated in the panel, which included ten samples in total: six influenza A viruses, three influenza B viruses, and one negative control sample. The cycle threshold value range for the positive viruses was 24–35 when analysed with the in-house PCR method at the PHAS. Correct results were reported by 19 of the participating laboratories. One laboratory reported a false negative result for influenza A, but correctly subtyped the same sample, indicating a potential reporting error in the influenza A result rather than an incorrect result.
In the event of methodological issues with clinical samples, Swedish clinical microbiological laboratories are welcome to contact the PHAS to compare their results with ours or to obtain sequence data for further investigation. This service is part of our role as the National Reference Laboratory for Influenza.
External quality assessment programmes
The PHAS participated in one external quality assessment programme during 2025, the Annual WHO External Quality Assessment Programme for influenza (WHO-EQAP), nr 24. The results are described below.
Molecular detection, typing, and sub/lineage-typing
Fifteen samples analysed by real-time PCR were correctly typed (A, B, or negative), and sub- and lineage typing for A(H1)pdm09, A(H3), A(H5), B/Victoria, and B/Yamagata was correctly reported except for the following two deviations:
- One influenza A sample could not be subtyped with real-time PCR because A(H9) subtyping with real-time PCR is not performed at the PHAS. Whole-genome sequencing established subtype A(H9), and this was confirmed in the final report. This procedure follows the routine protocol at the PHAS in cases where the influenza A subtype cannot be established but where virus titres are high enough for further investigation
- One influenza A sample was incorrectly subtyped as human seasonal influenza A(H3); however, it was of swine A(H3) origin. The Ct-values differed significantly between the influenza A typing assay and the subtyping assay, prompting a comment in the results section for further evaluation via sequencing. Due to time constraints, sequencing could not be completed before the panel deadline. However, this is the established procedure at the PHAS for cases with such discrepancies. The sample was included in the panel for educational purposes (not scored), and other participating labs reported similar results.
Genotyping analysis
Four additional samples were sequenced on an Ion Torrent platform. Resistance analysis was performed on the NA and PA genes of these samples.
Two of the four samples carried mutations in the NA gene associated with reduced or highly reduced susceptibility to oseltamivir. These results were correct.
Three of the four samples carried no previously known mutations in the PA gene that inhibit susceptibility to baloxavir. The fourth sample could not be evaluated due to poor sequence quality of the PA gene. This sample carried mutation I38T and was included in the panel for educational purposes.
For two of the four samples, reporting for HA gene clade designation could be performed. Analysis including amino acid substitution and phylogenetic relationship evaluation for the HA gene was performed and the correct results for clade designation were reported.
Tables and figures
Respiratory viruses in Sweden during the 2025–2026 season
Figure 1. Weekly number of confirmed cases of COVID-19, influenza A, influenza B, and RSV during the 2025–2026 season.
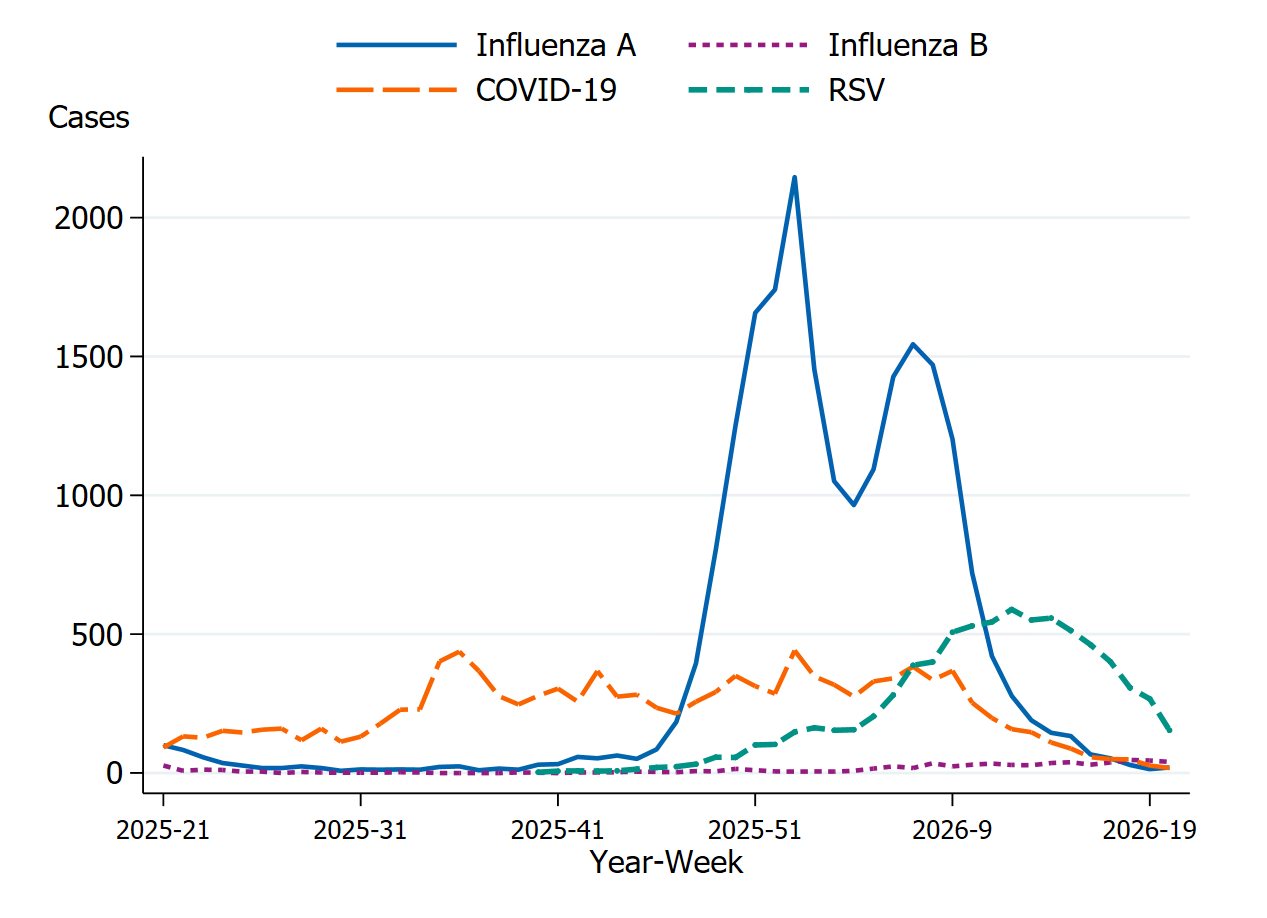
Figure 2. Weekly samples analysed and number of laboratory-confirmed cases of influenza, COVID-19, and RSV. Week 27, 2023, to week 20, 2026.
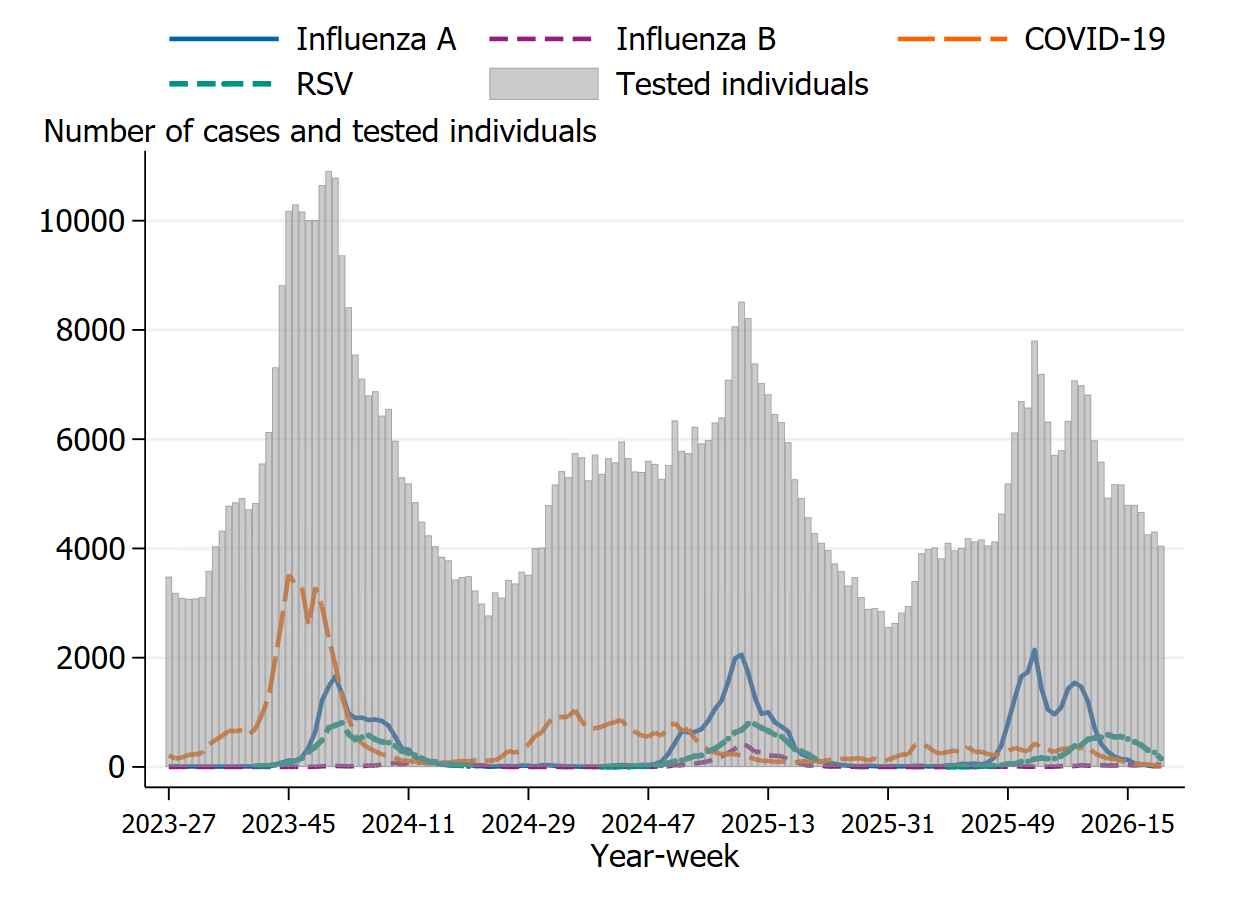
Figure 3. Weekly percentage of samples testing positive for influenza, COVID-19, and RSV. Week 27, 2023, to week 20, 2026.
| Indicator | Cases | Hospitalised | ICU (to week 15) | Deaths |
|---|---|---|---|---|
| COVID-19 number | 8,004 | 5,112 | 76 | 553 |
| Influenza number | 21,419 | 8,391 | 317 | 1,070 |
| COVID-19 median age (IQR) | 76 yrs (56–84 yrs) | 78 yrs (64–85 yrs) | 71.5 yrs (51–78 yrs) | 83 yrs (78–89 yrs) |
| Influenza median age (IQR) | 69 yrs (34–81 yrs) | 76 yrs (60–84 yrs) | 66 yrs (50–77 yrs) | 85 yrs (79–90 yrs) |
Figure 4 shows the incidence rate ratios (IRR) with 95% confidence intervals for the incidence of influenza compared to COVID-19 for each indicator in the age group 65 years or older. Indicators include laboratory-confirmed cases, hospitalisations with influenza or COVID-19 as the primary diagnosis (as applicable), intensive care unit (ICU) admissions, and deaths within 30 days of diagnosis. Indicator data are summarised for the period October–April in each season; for 2025–2026, data up to and including March 29, 2026 are included. The dashed line indicates an IRR of 1, meaning no difference in incidence rates. Values to the left of the dashed line (IRR below 1) indicate a higher incidence rate for COVID-19, as in the 2023–2024 season, while values to the right (IRR above 1) indicate a higher incidence rate for influenza, as in the 2025–2026 season. Please observe that the x-axis scale is logarithmic.
Figure 4. Incidence rate ratios of influenza compared to COVID-19, per indicator and season, for the age group 65 years or older, from 2022–2023 to 2025–2026.
Laboratory-confirmed influenza cases
| Indicator | 2021–2022 | 2022–2023 | 2023–2024 | 2024-2025 | 2025-2026 |
|---|---|---|---|---|---|
| Analysed samples | 425,423 | 324,112 | 239,633 | 220,056 | 175,763 |
| Proportion positive samples | 3% | 7% | 7% | 11% | 12% |
| Total positive for influenza A | 13,150 | 17,848 | 15,291 | 20,496 | 20,822 |
| Total positive for influenza B | 137 | 5,167 | 1,169 | 3,710 | 597 |
| Total (influenza A + B) | 13,287 | 23,015 | 16,460 | 24,206 | 21,419 |
Figure 5. Weekly number of laboratory-confirmed cases of influenza (all types), 2021–2022 to 2025–2026.
Viral distribution by influenza type
Table 6 shows each influenza subtype/lineage as a percentage of all subtyped/lineage-typed samples during the past three seasons within the sentinel sampling season and the laboratory reporting system. Data on positive samples not analysed for subtype or lineage are excluded, as are samples subtyped as both influenza A(H3) and A(H1)pdm09.
| Influenza subtype/lineage | 2023–2024 Sent. | 2023–2024 Lab | 2024–2025 Sent. | 2024–2025 Lab | 2025–2026 Sent. | 2025–2026 Lab |
|---|---|---|---|---|---|---|
| A(H1N1)pdm09 | 69% | 63% | 50% | 61% | 31% | 34% |
| A(H3N2) | 22% | 32% | 27% | 34% | 64% | 63% |
| B/Victoria | 8% | 5% | 23% | 4% | 5% | 3% |
| B/Yamagata | – | – | – | – | – |
Please note that the figure 6 does not include unsubtyped influenza A cases, which made up the majority of influenza A cases during the season.
Figure 6. The number of subtyped influenza A cases in the laboratory reporting system per week, 2025–2026.
Please note that the figure (7) does not include unsubtyped influenza A cases, which made up the majority of influenza A cases during the season.
Figure 7. The weekly percentage of influenza A cases by subtype in the laboratory reporting system, 2025–2026.
Age distribution
Figure 8. Weekly notification rate (cases per 100,000 population) of influenza A per age group in Sweden, 2025–2026 season.
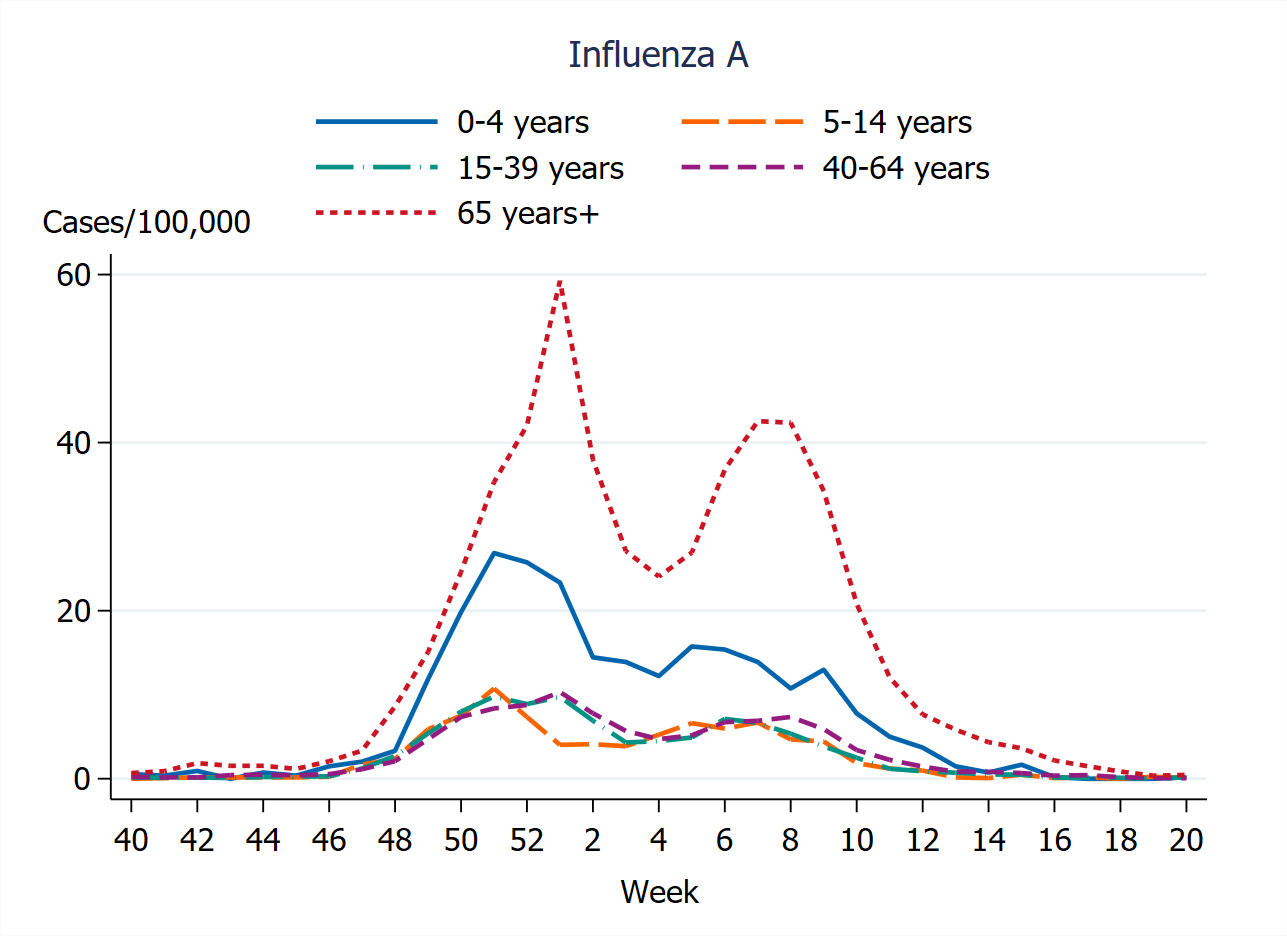
Figure 9. Cumulative notification rate (cases per 100,000 population) of laboratory-confirmed influenza cases per age group and season, Sweden, 2021–2022 to 2025–2026, in order from left to right.
Figures 10, 11 and 12 are density plots. These show the distribution of cases by age. They do not reflect the actual number of cases in each age, but rather which ages are most frequent in the data. Figure 10 shows the age distribution per season for cases of influenza A, with varying dominance of subtypes for each season. As shown, laboratory-confirmed cases are concentrated in older age groups, with a smaller proportion among children and young adults. Season 2020–2021 is excluded due to the small number of cases.
In Figure 11, the distribution of influenza B cases is shown for seasons during which influenza B accounted for more than 10 percent of all laboratory-confirmed cases. Season 2017–2018 was dominated by influenza B/Yamagata and cases were concentrated mainly among the elderly, similar to influenza A seasons. The other influenza B seasons shown have only had circulation of B/Victoria, where laboratory-confirmed cases are mainly is seen children and young adults.
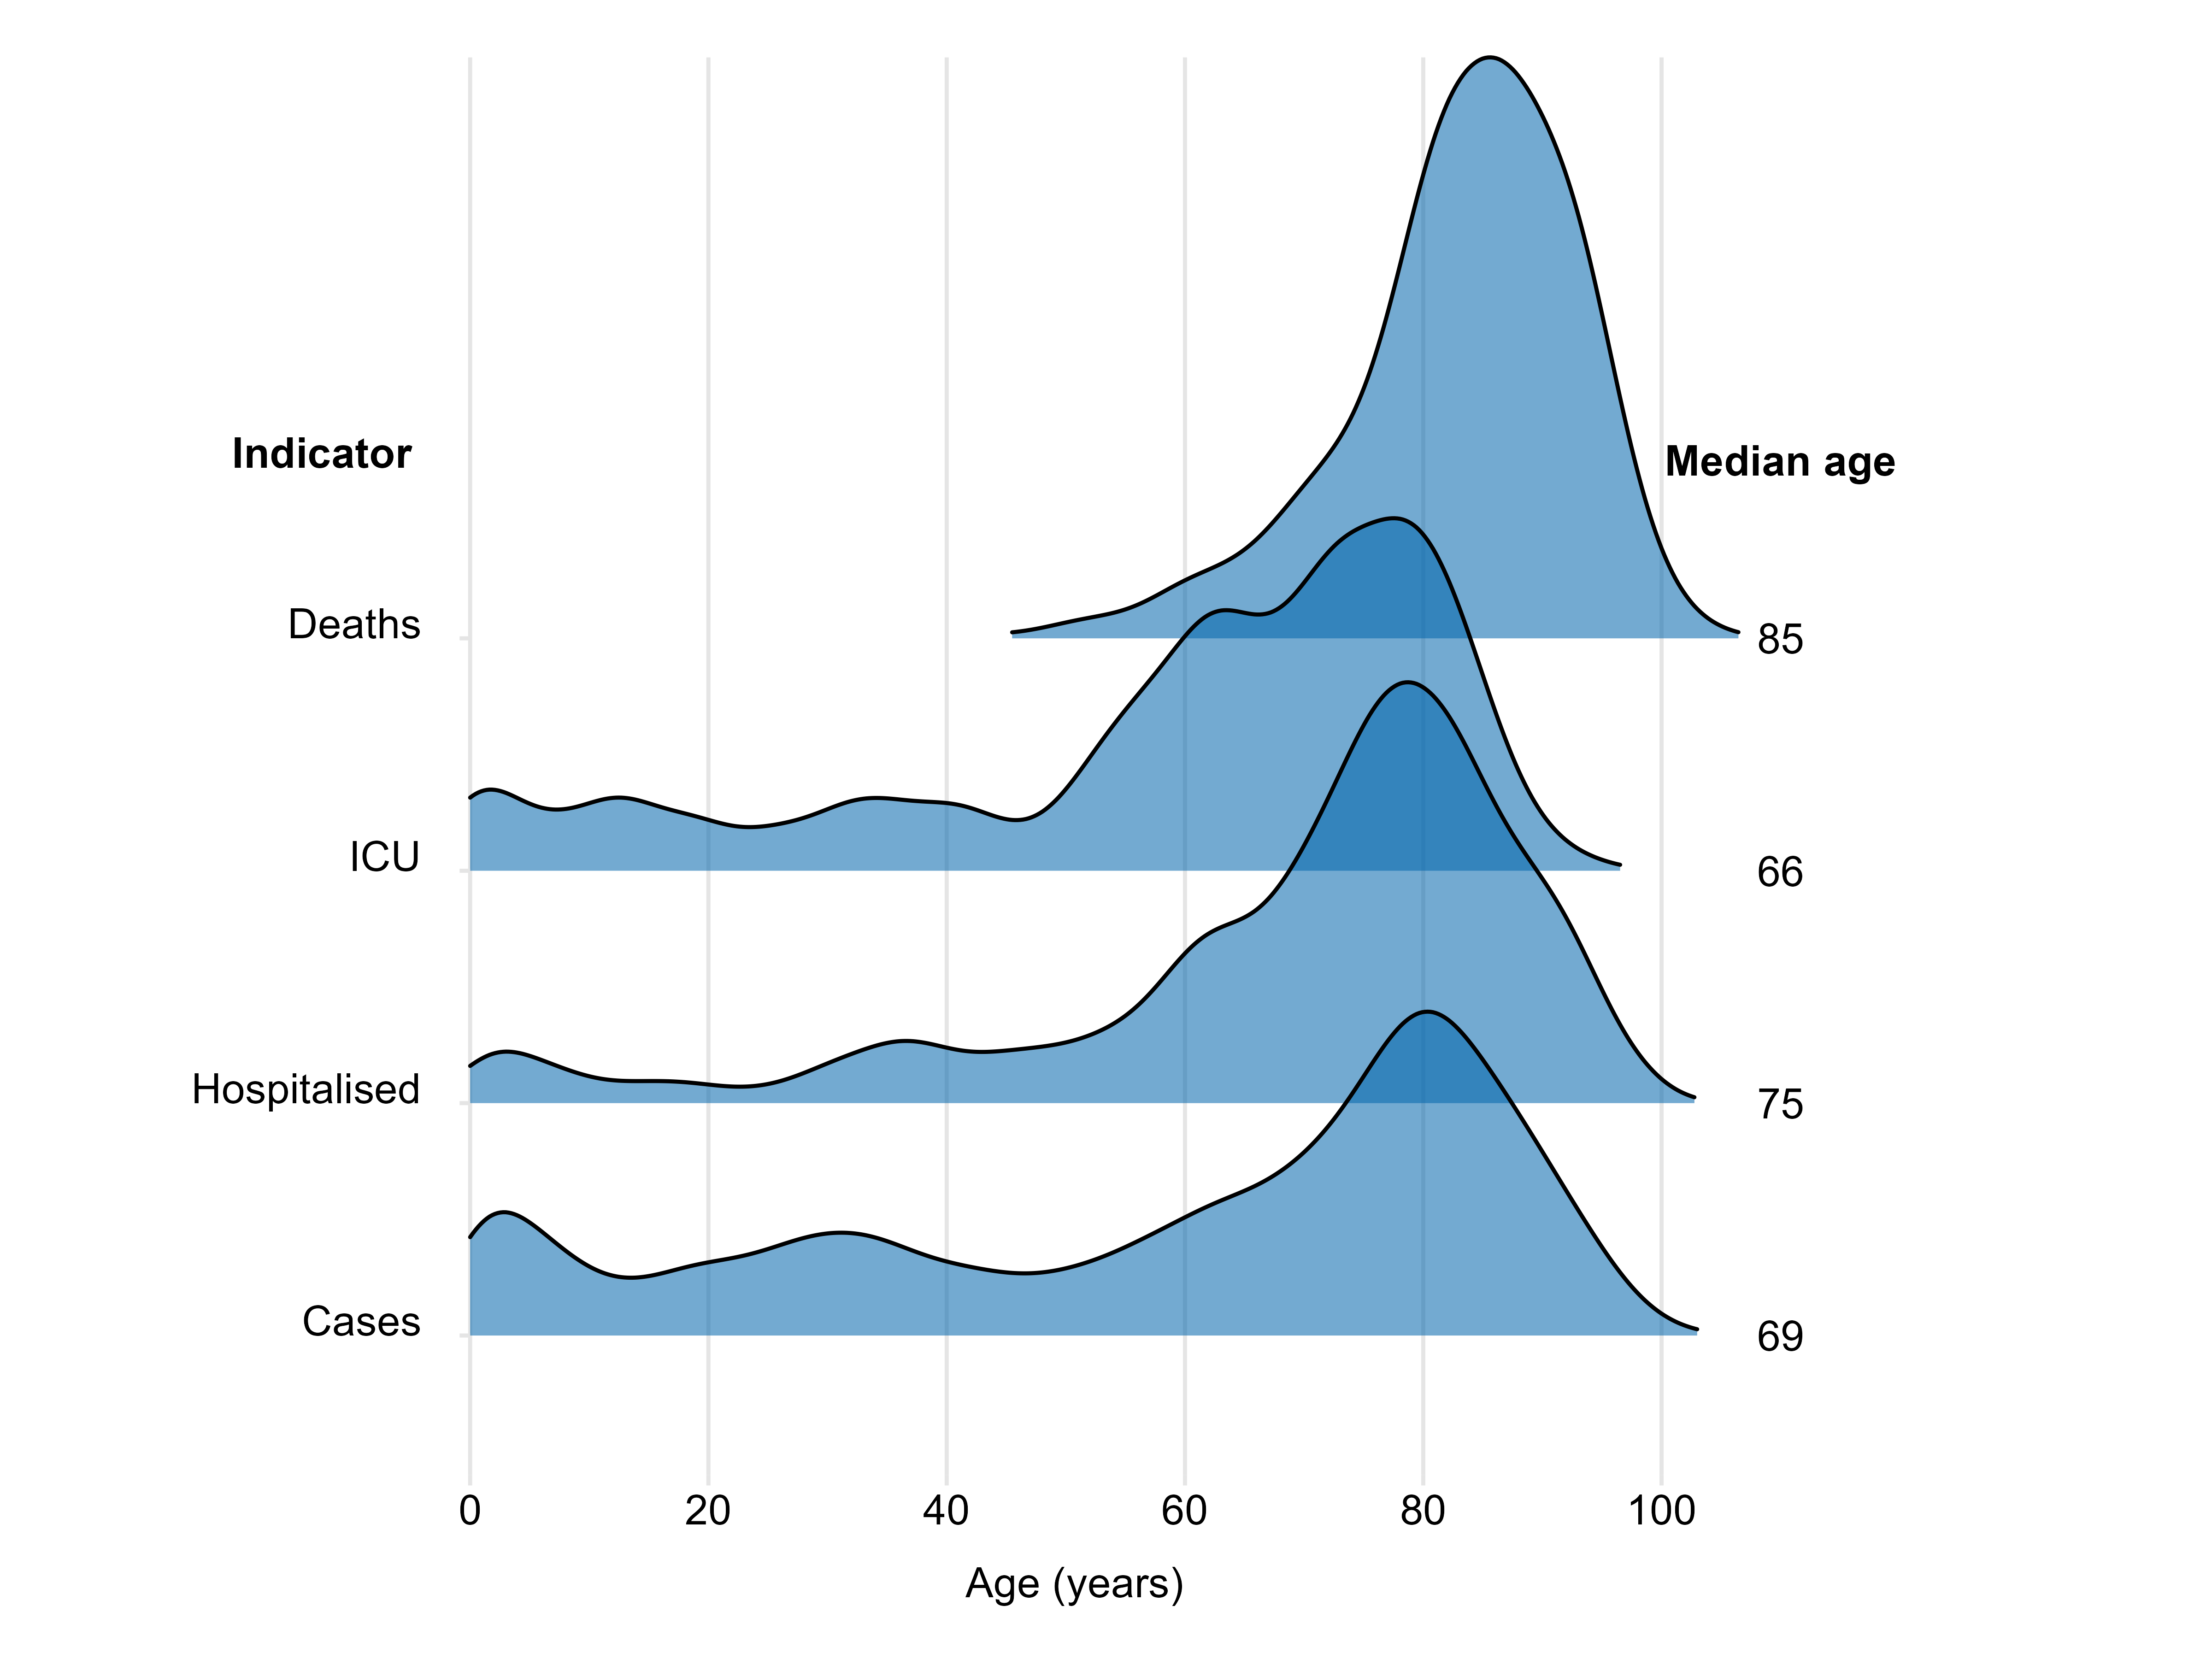
Figure 12 shows that severe cases are mainly concentrated in older age groups.
Figure 10. Relative age distribution and median age of laboratory-confirmed influenza A-cases by season, 2017–2018 to 2025–2026.
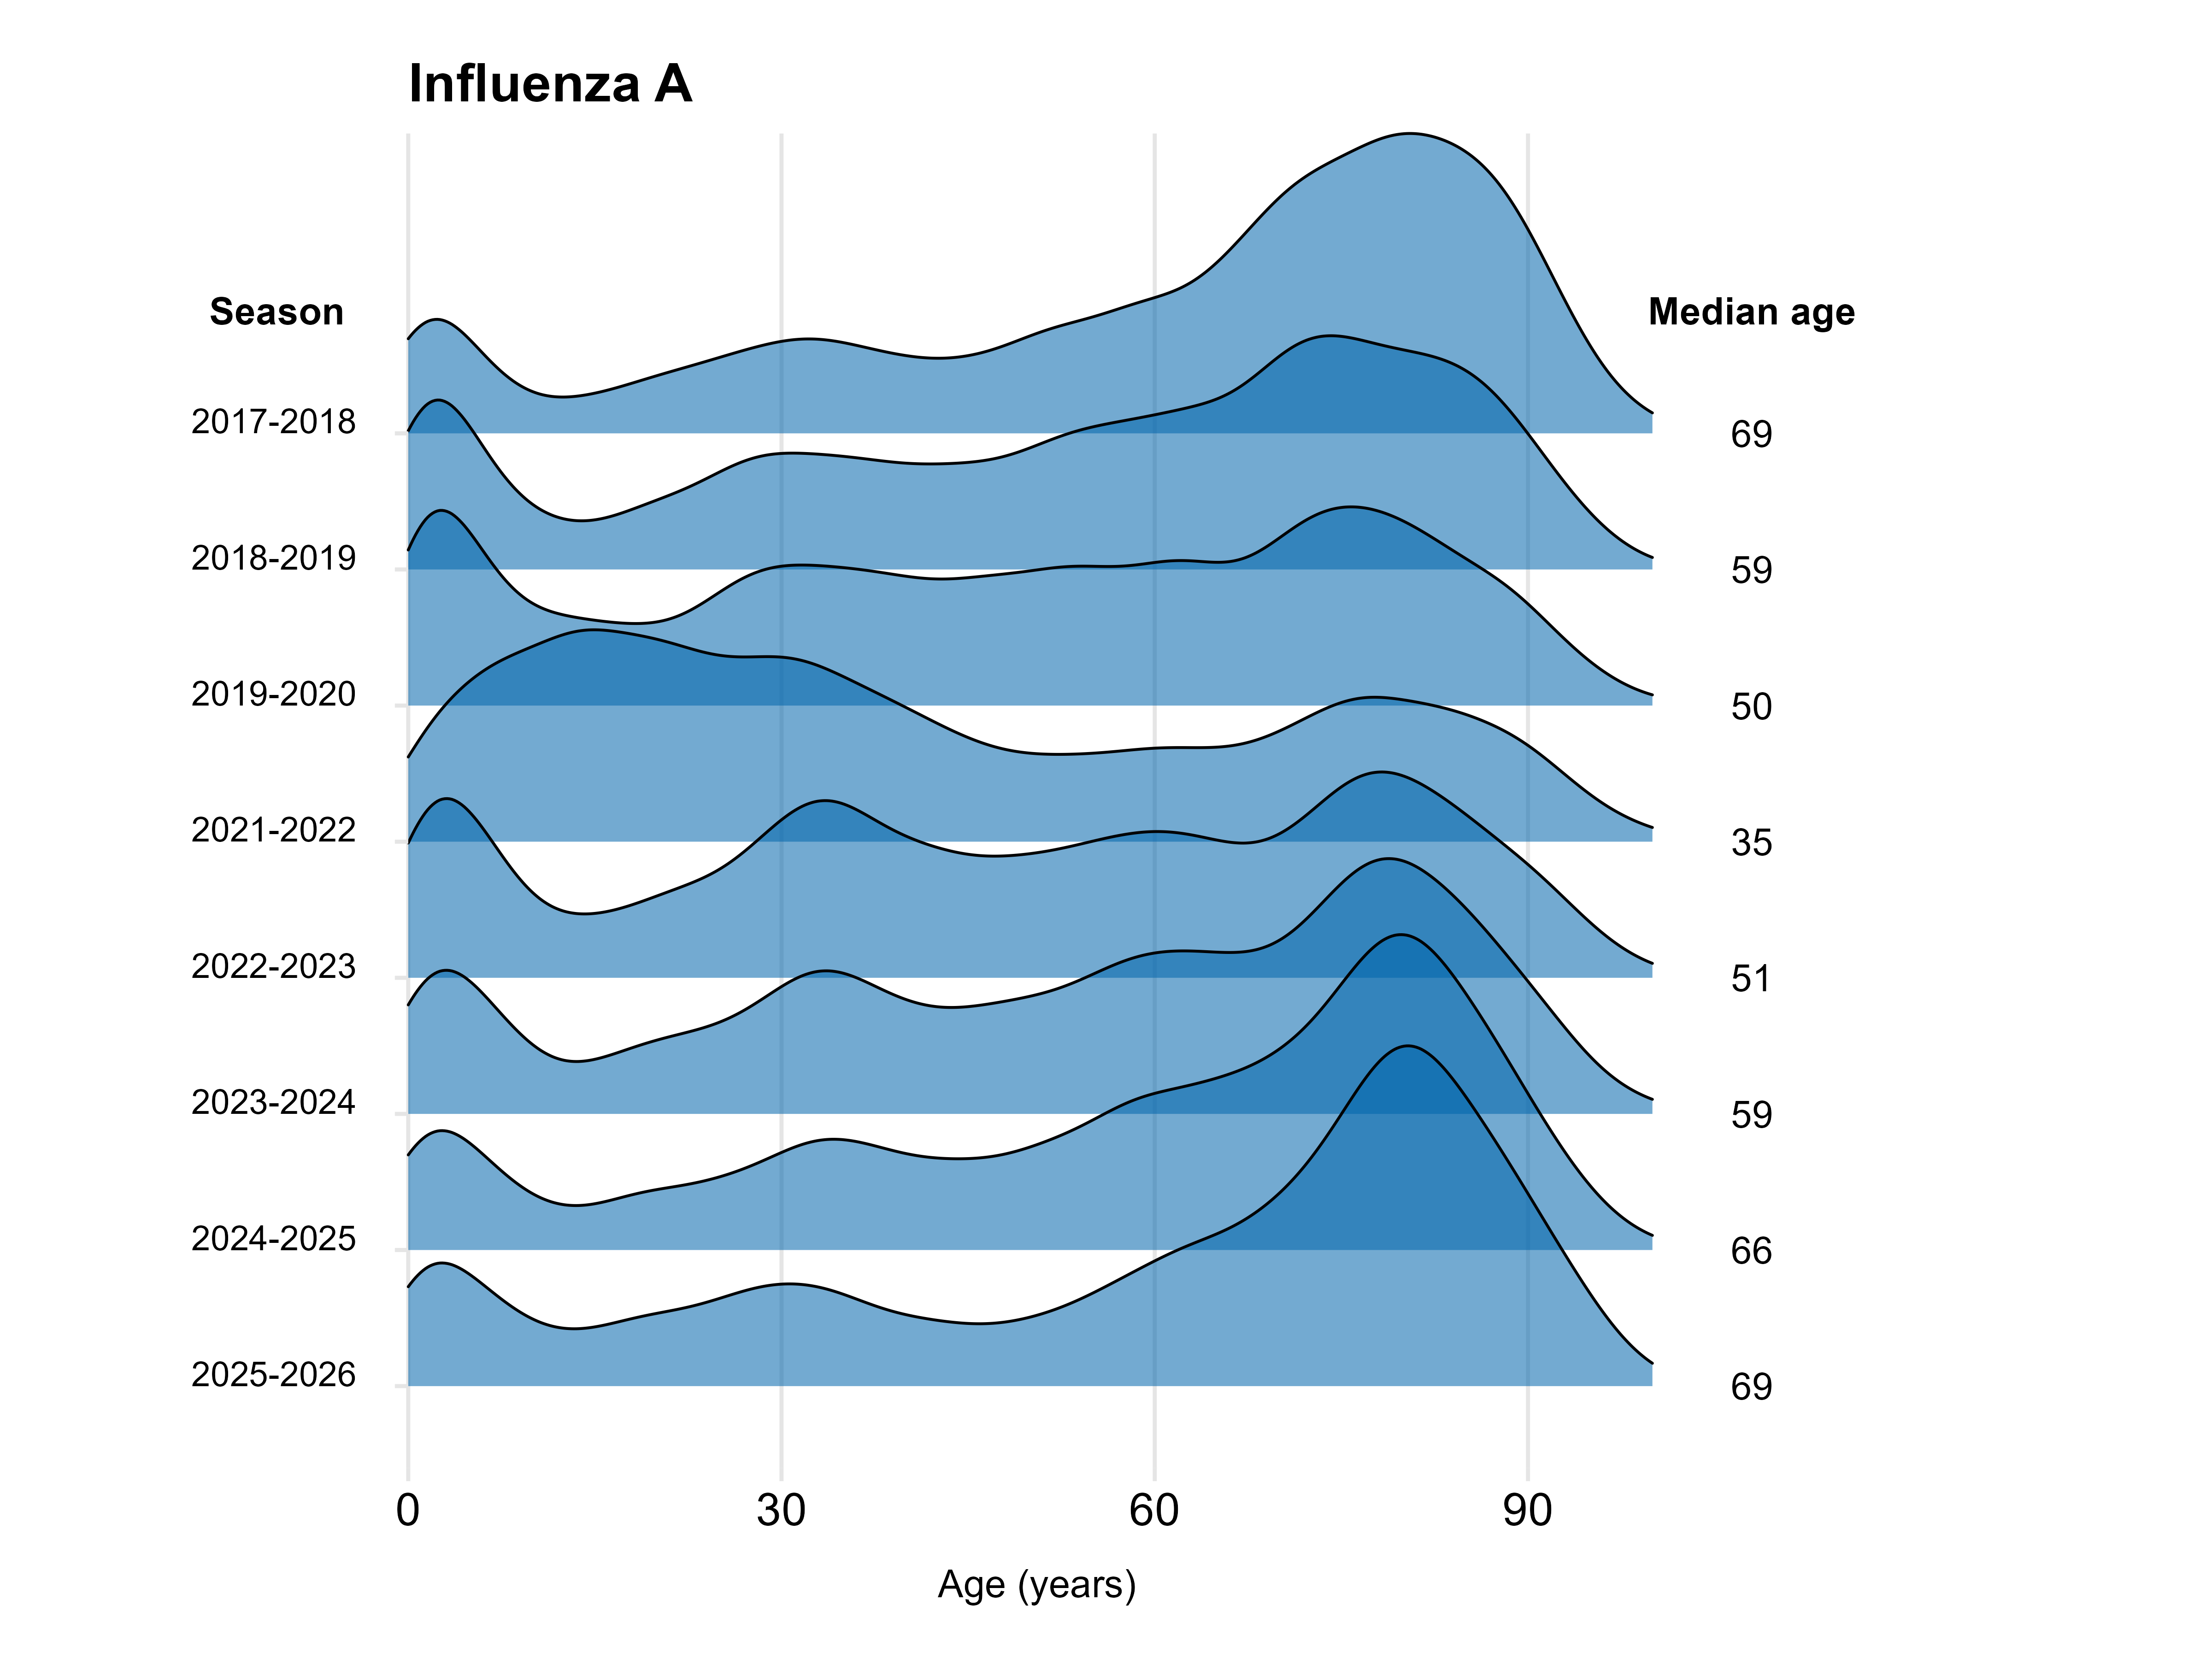
Figure 11. Relative age distribution and median age of laboratory-confirmed influenza B-cases by season, 2017–2018, 2019–2020, 2022–2023, and 2024–2025.
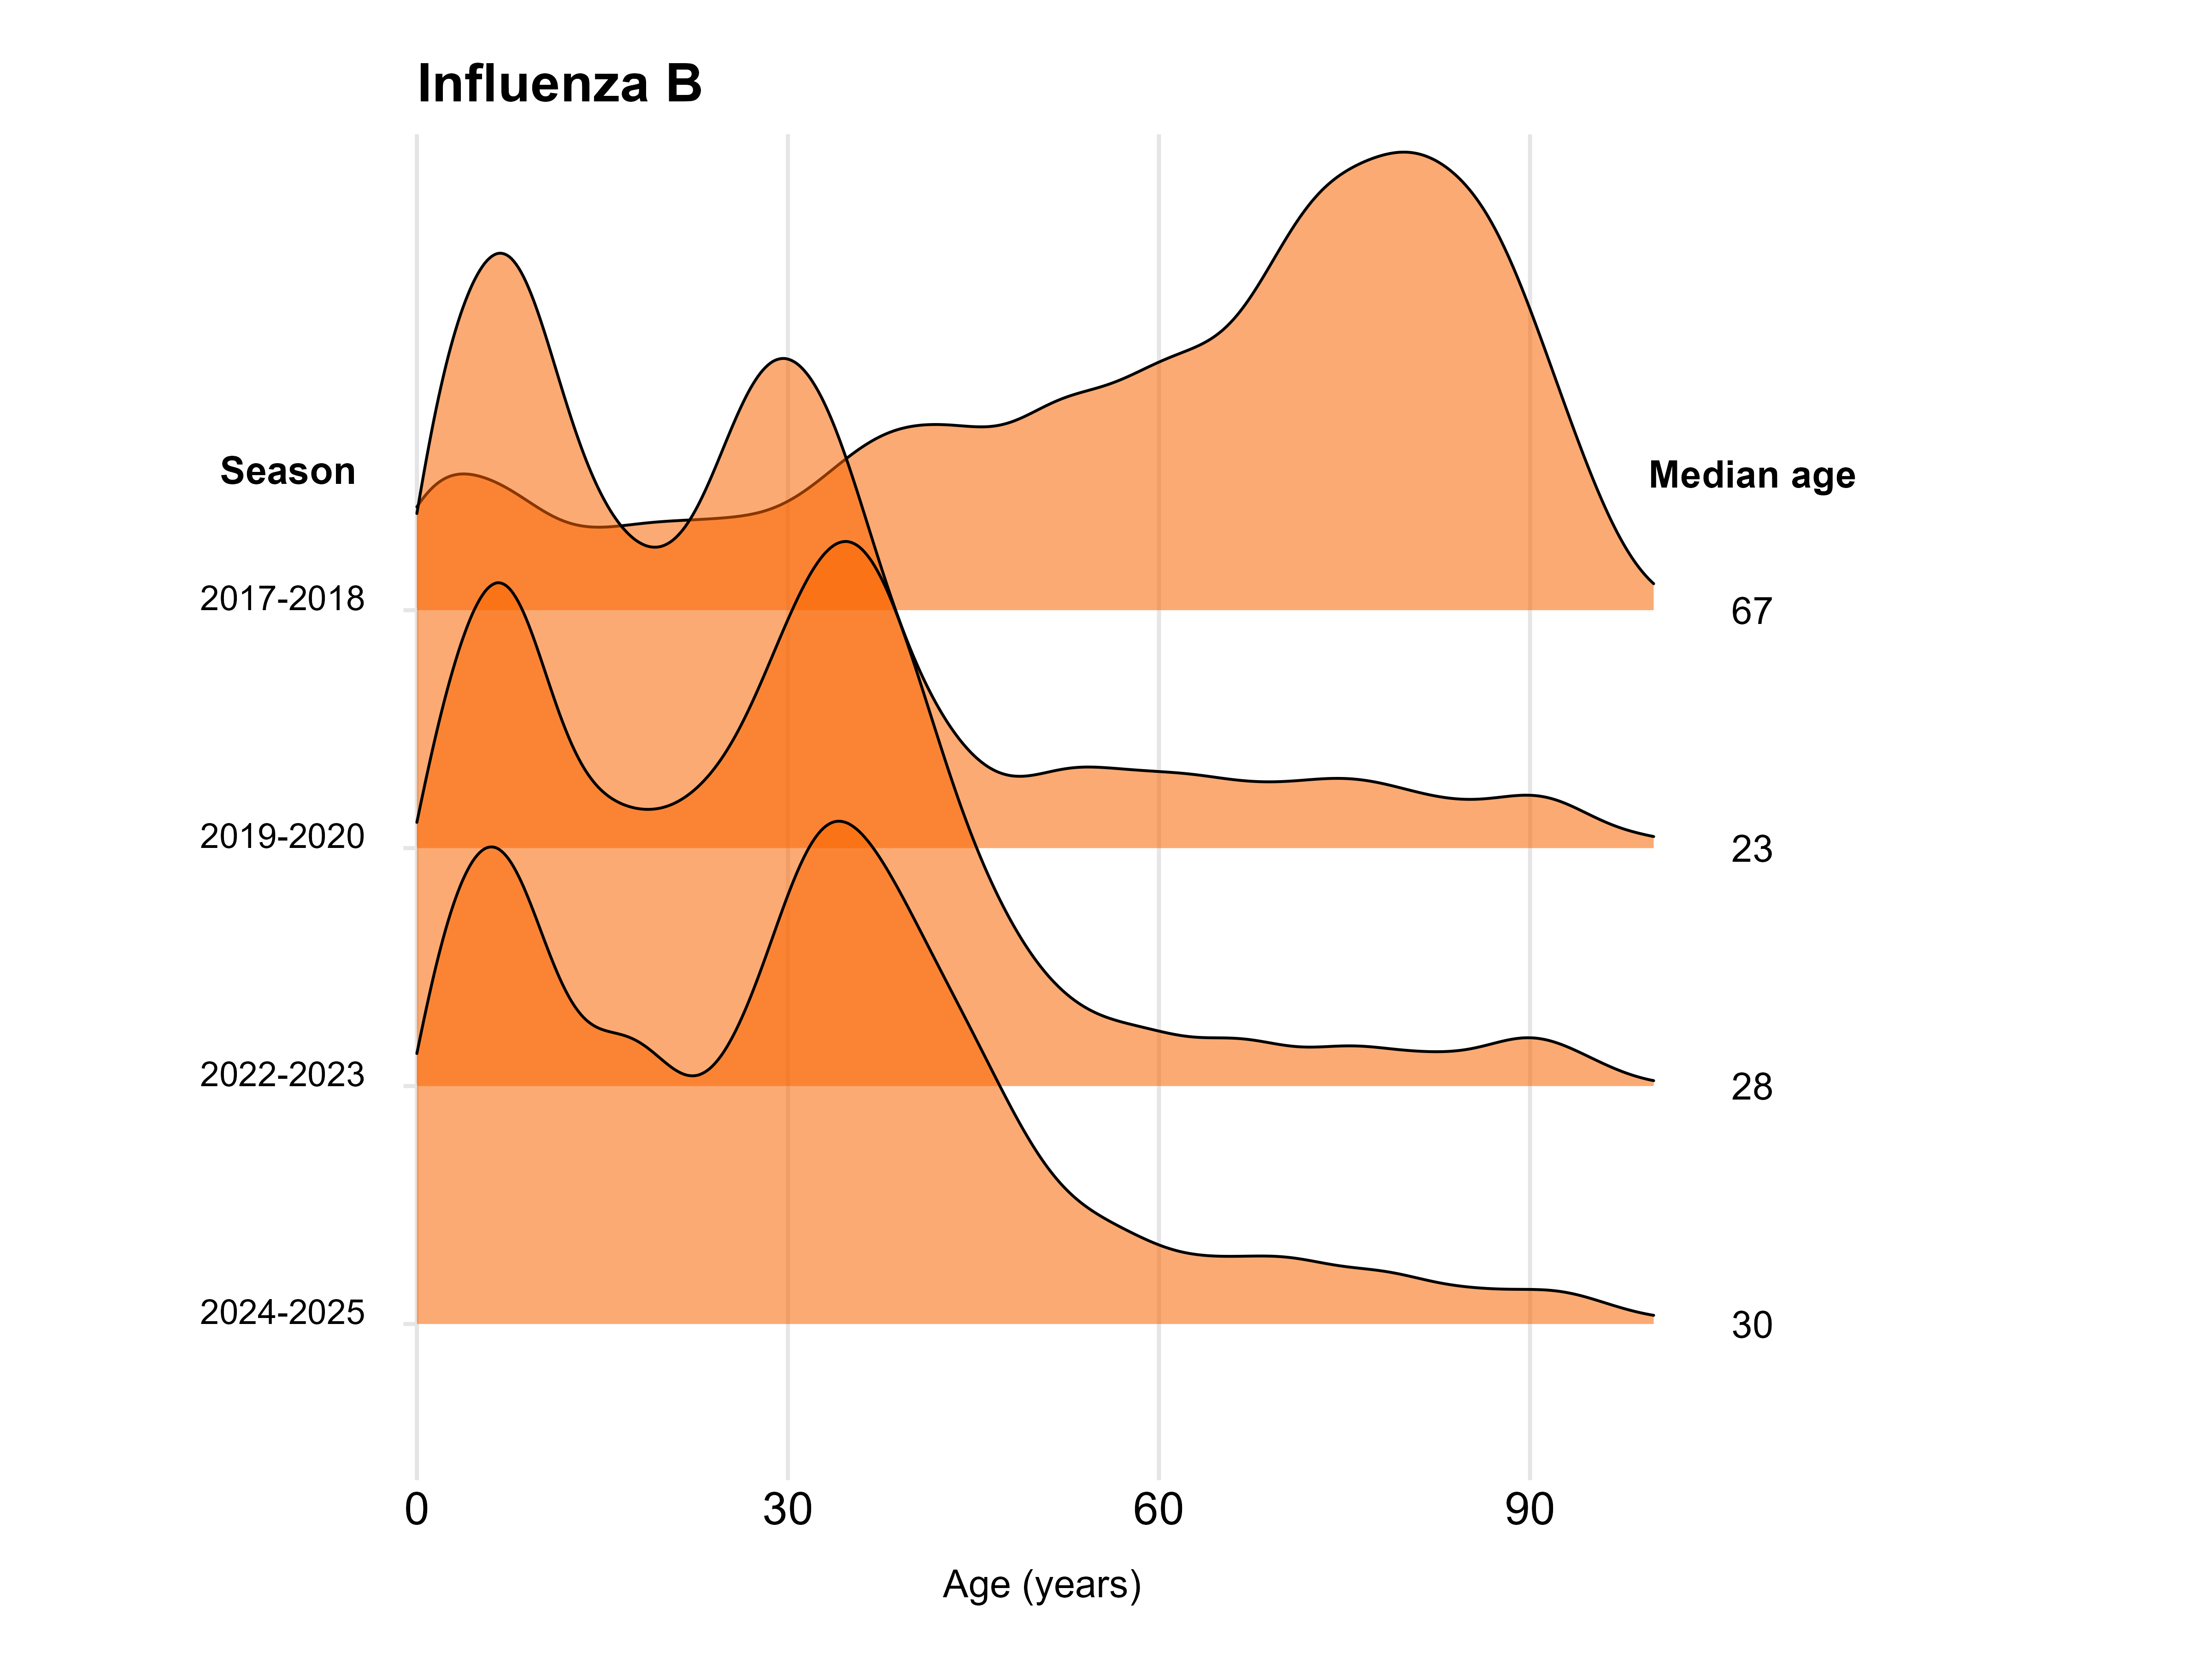
Figure 12. Relative age distribution and median age of laboratory-confirmed influenza cases by severity level (cases, hospitalised, intensive care unit (ICU), and deaths).
Sentinel sampling
Figure 13. Weekly number of sentinel samples submitted and positive samples by influenza subtype/lineage, 2025–2026. The graph also includes positive SARS-CoV-2 and RSV samples. See Table 9 for underlying data.
| Season | 2023-2024 | 2024-2025 | 2025-2026 |
|---|---|---|---|
| Analysed | 565 | 829 | 490 |
| Positive for influenza | 88 | 167 | 138 |
| Proportion positive | 16% | 20% | 28% |
| Positive for influenza A | 81 | 130 | 132 |
| Positive for influenza B | 7 | 37 | 6 |
| Type or subtype | 2023–2024 number | 2023–2024 median age | 2023–2024 ILI | 2024–2025 number | 2024–2025 median age | 2024–2025 ILI | 2025–2026 number | 2025–2026 median age | 2025–2026 ILI |
|---|---|---|---|---|---|---|---|---|---|
| Analysed | 565 | 47 | 81% | 829 | 46 | 83% | 490 | 50 | 79% |
| A(H1N1)pdm09 | 81 | 39 | 86% | 83 | 49 | 89% | 41 | 44 | 83% |
| A(H3N2) | 7 | 41 | 89% | 45 | 35 | 100% | 82 | 30 | 88% |
| A, not subtyped | 3 | 57 | 100% | 2 | 51 | 100% | 10 | 58 | 90% |
| B/Victoria | 7 | 29 | 100% | 37 | 30 | 97% | 6 | 33 | 50% |
| B/Yamagata | - | - | - | - | - | - | - | - | - |
| Year-week | Samples | A(H1)pdm09 | A(H3) | A, not subtyped | B/Victoria | SARS-CoV-2 | RSV |
|---|---|---|---|---|---|---|---|
| 2025-40 | 0 | 0 | 0 | 0 | 0 | 0 | 0 |
| 2025-41 | 6 | 0 | 0 | 0 | 0 | 1 | 0 |
| 2025-42 | 15 | 0 | 0 | 0 | 0 | 1 | 0 |
| 2025-43 | 17 | 0 | 0 | 0 | 0 | 1 | 1 |
| 2025-44 | 16 | 0 | 0 | 0 | 0 | 1 | 0 |
| 2025-45 | 22 | 0 | 0 | 0 | 0 | 2 | 0 |
| 2025-46 | 23 | 0 | 0 | 0 | 0 | 1 | 0 |
| 2025-47 | 13 | 0 | 0 | 0 | 0 | 4 | 0 |
| 2025-48 | 20 | 1 | 1 | 0 | 0 | 1 | 1 |
| 2025-49 | 29 | 5 | 5 | 2 | 0 | 0 | 2 |
| 2025-50 | 48 | 12 | 10 | 0 | 0 | 4 | 2 |
| 2025-51 | 36 | 5 | 12 | 3 | 1 | 2 | 0 |
| 2025-52 | 5 | 0 | 2 | 0 | 0 | 0 | 1 |
| 2026-01 | 23 | 0 | 5 | 0 | 2 | 1 | 4 |
| 2026-02 | 19 | 1 | 5 | 0 | 0 | 1 | 1 |
| 2026-03 | 32 | 2 | 12 | 0 | 0 | 2 | 1 |
| 2026-04 | 32 | 2 | 8 | 2 | 1 | 2 | 3 |
| 2026-05 | 13 | 0 | 5 | 0 | 0 | 0 | 0 |
| 2026-06 | 22 | 3 | 5 | 2 | 0 | 5 | 3 |
| 2026-07 | 15 | 3 | 3 | 0 | 0 | 2 | 1 |
| 2026-08 | 13 | 2 | 2 | 0 | 0 | 1 | 1 |
| 2026-09 | 19 | 4 | 2 | 1 | 0 | 1 | 4 |
| 2026-10 | 13 | 1 | 3 | 0 | 1 | 0 | 2 |
| 2026-11 | 9 | 0 | 0 | 0 | 1 | 0 | 0 |
| 2026-12 | 11 | 0 | 1 | 0 | 0 | 0 | 2 |
| 2026-13 | 2 | 0 | 1 | 0 | 0 | 0 | 0 |
| 2026-14 | 1 | 0 | 0 | 0 | 0 | 0 | 0 |
| 2026-15 | 7 | 0 | 0 | 0 | 0 | 0 | 1 |
| 2026-16 | 0 | 0 | 0 | 0 | 0 | 0 | 0 |
| 2026-17 | 1 | 0 | 0 | 0 | 0 | 0 | 1 |
| 2026-18 | 2 | 0 | 0 | 0 | 0 | 0 | 0 |
| 2026-19 | 5 | 0 | 0 | 0 | 0 | 0 | 0 |
| 2026-20 | 1 | 0 | 0 | 0 | 0 | 0 | 0 |
| Total | 490 | 41 | 82 | 10 | 6 | 33 | 31 |
Hospitalised influenza cases
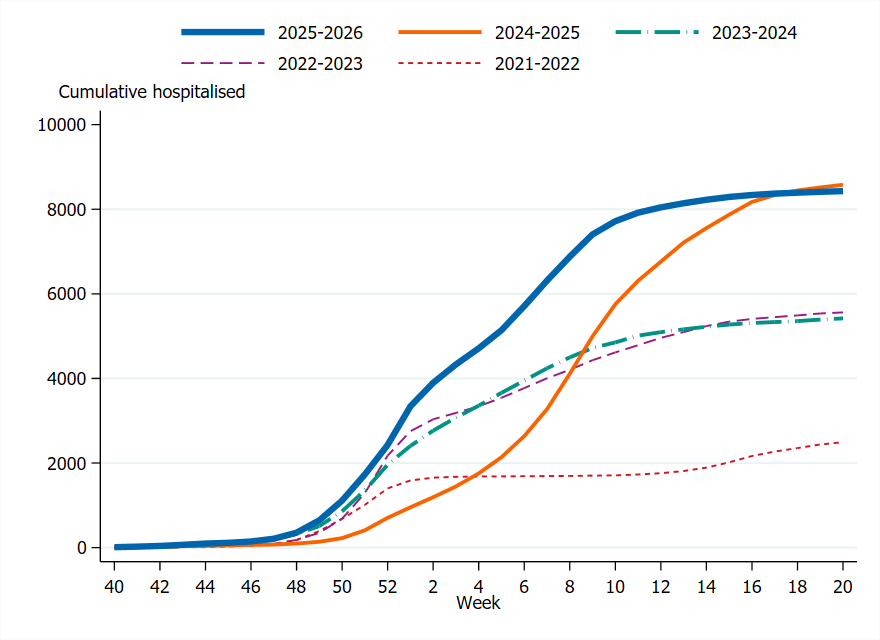
To enable comparison with past seasons, the weekly cumulative number of hospitalised patients is shown for the past several seasons in Figure 15. The two latest seasons had a similar number of hospitalisations (approximately 8,500), while 2022–2023 and 2023–2024 had a lower number (approximately 5,500). These four seasons had significant transmission of both influenza A subtypes, but with varying distribution and different patterns of transmission. The earliest season shown (2021–2022) had just over 2,000 hospitalisations, because of low intensity and because the season was interrupted by the transmission of COVID-19.
Figure 14. Weekly number of hospitalised patients with laboratory-confirmed influenza and a primary diagnosis of influenza or pneumonia, 2021–2022 to 2025–2026.
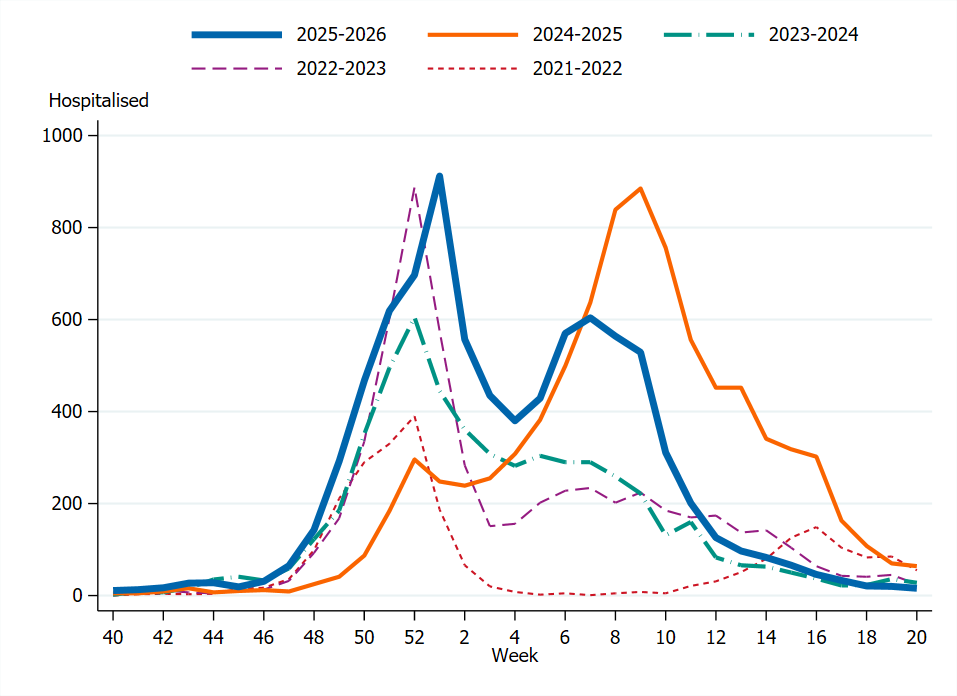
Figure 15. Cumulative number of hospitalised patients with laboratory-confirmed influenza and a primary diagnosis of influenza or pneumonia, 2021–2022 to 2025–2026.
Influenza cases in intensive care
The cumulative number of patients in intensive care with laboratory-confirmed influenza in total and by influenza type and subtype is shown in Table 10. Cases with samples subtyped as both A(H1)pdm09 and A(H3) are included as A (not subtyped) in Table 10 (2022–2023: 1 case, 2024–2025: 1 case, 2025–2026: 3 cases).
| Type or subtype | 2021–2022 | 2022–2023 | 2023–2024 | 2024–2025 | 2025–2026 |
|---|---|---|---|---|---|
| Influenza A (not subtyped) | 84 | 196 | 225 | 172 | 193 |
| Influenza A(H1)pdm09 | 2 | 47 | 73 | 94 | 57 |
| Influenza A(H3) | 24 | 37 | 18 | 35 | 63 |
| Influenza B | 0 | 72 | 20 | 37 | 4 |
| Total | 110 | 352 | 335 | 338 | 317 |
Figure 16. Cumulative incidence of patients with influenza in intensive care per week (patients per 100,000 population), per age group and season, Sweden, 2021–2022 to 2025–2026, in order from left to right.
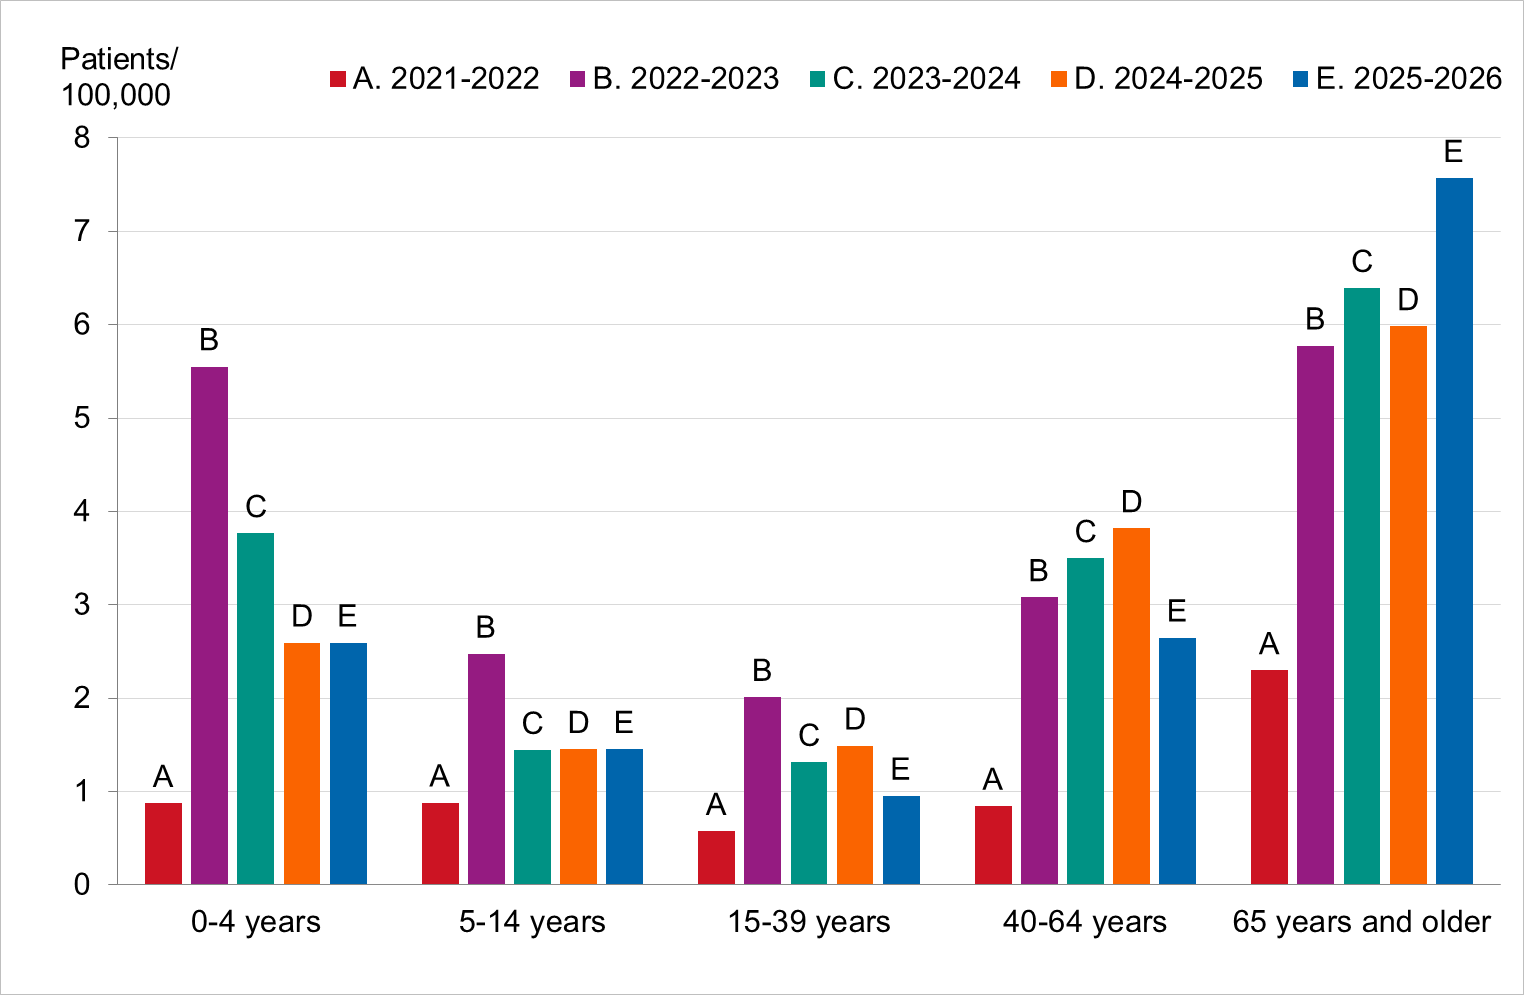
Figure 17. Weekly number of new patients with influenza in intensive care in Sweden, 2022–2023 to 2025–2026, with data to week 15, 2026.
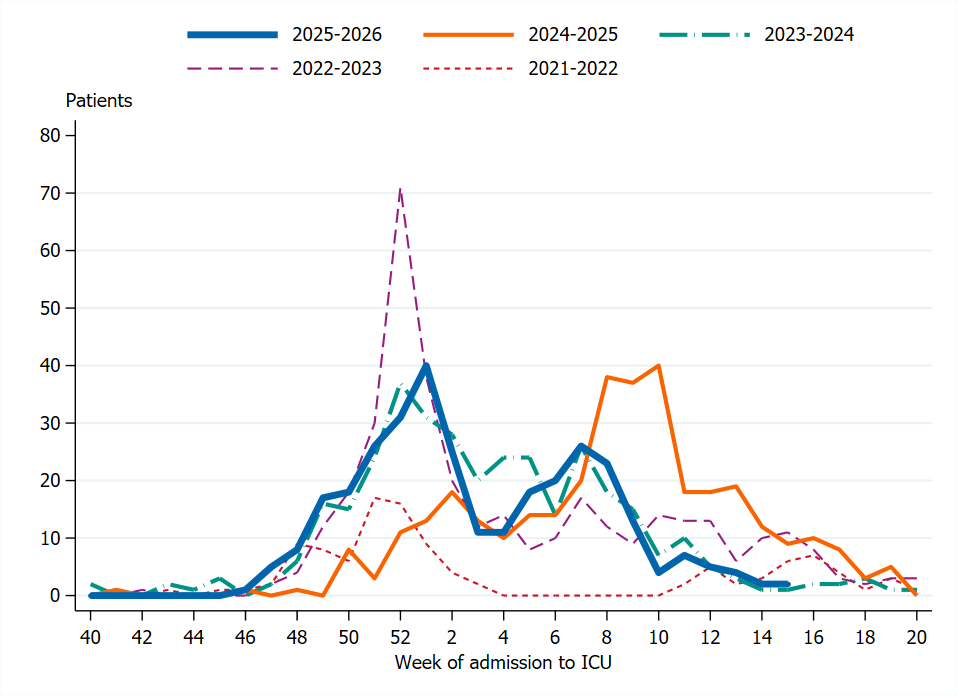
Figure 18. Cumulative incidence of patients with influenza in intensive care per week in Sweden, 2017–2018 to 2025–2026 (to week 15, 2026).
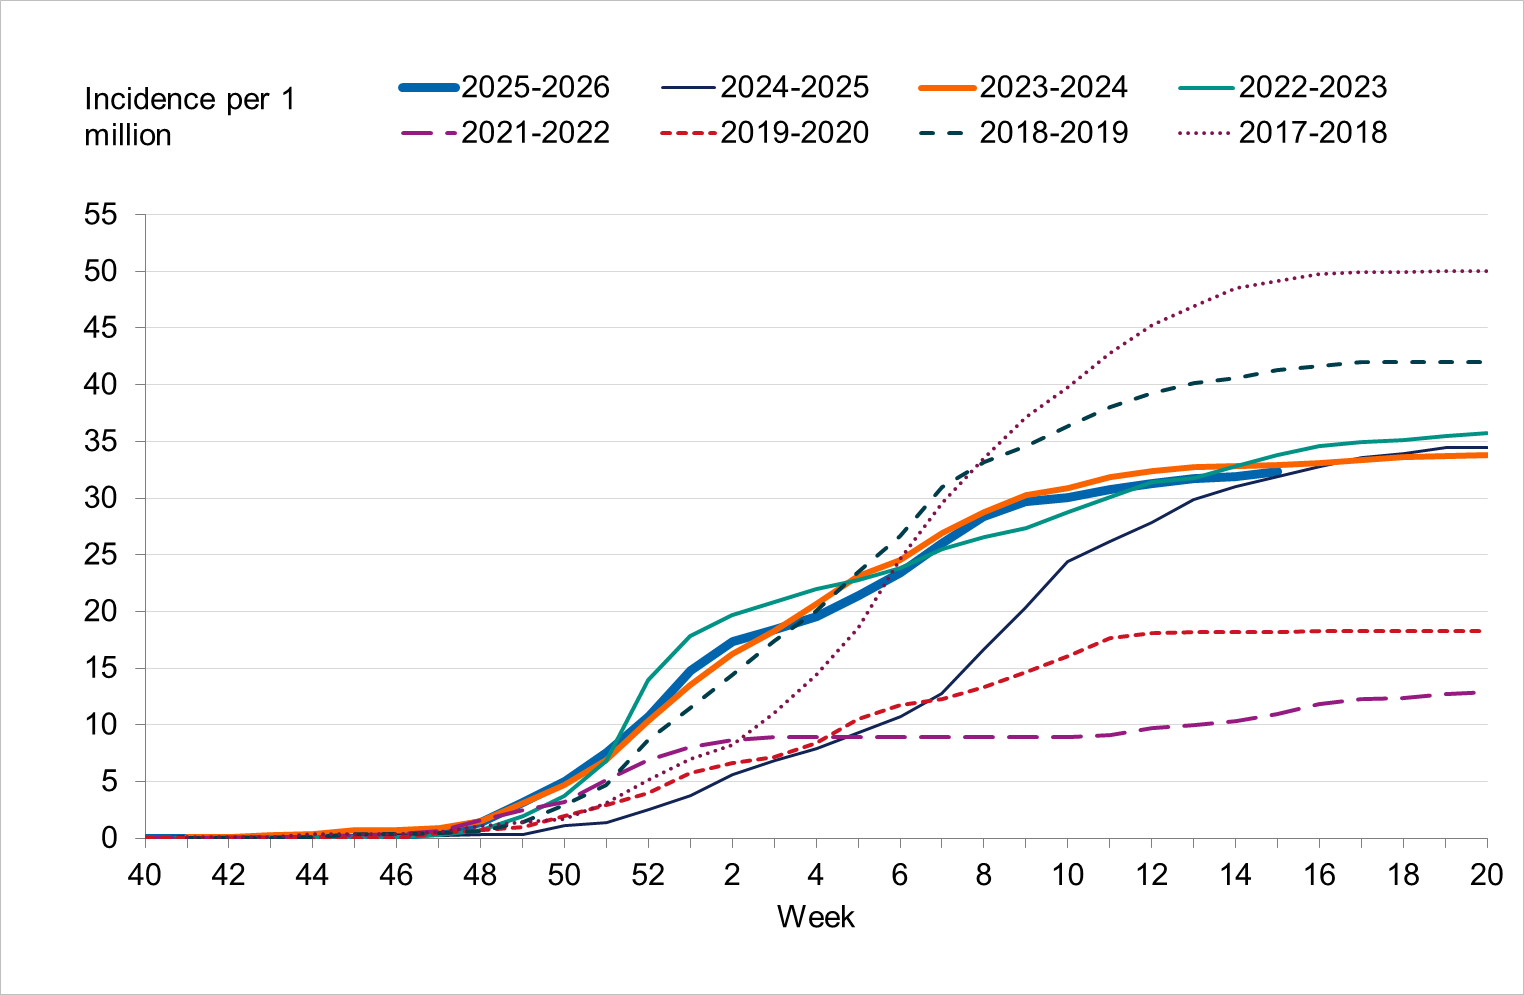
To enable comparison with past seasons, the weekly cumulative incidence of patients in intensive care with influenza is shown for the past several seasons. When grouped in terms of highest to lowest cumulative incidence, the seasons can be roughly separated into three groups. The first is seasons with the highest cumulative incidence, namely 2017–2018, dominated by B/Yamagata, and 2018–2019, dominated by influenza A(H1N)pdm09. The second is the middle, including the four latest seasons (2022–2023 to 2025–2026), which had significant transmission of both influenza A subtypes. The third is those seasons with lower cumulative incidence, namely 2019–2020, which was a season with mixed circulation of influenza viruses, and 2021–2022, which was dominated by A(H3N2). Both of these seasons were of low-medium intensity and were seasons where the COVID-19 pandemic interrupted the transmission of influenza. The 2020–2021 season is not included due to the small number of cases.
Influenza-related mortality
The table below uses data on deaths retrieved from Swedish Tax Agency data on June 17, 2026, on cases from week 40, 2025, to week 20, 2026, with reported age. Status after 30 days could not be ascertained for 174 cases whose personal identification number was not included in the case report, and these have been excluded from the analysis.
| Indicator | <40>yrs | 40–64 yrs | 65–69 yrs | 70–74 yrs | 75–79 yrs | 80–84 yrs | 85–89 yrs | 90–94 yrs | ≥95 yrs | Total |
|---|---|---|---|---|---|---|---|---|---|---|
| Total Cases | 6,038 | 3,518 | 1,236 | 1,656 | 2,471 | 2,727 | 1,979 | 1,192 | 427 | 21,244 |
| Cases/100,000 | 118 | 108 | 225 | 327 | 491 | 770 | 1,047 | 1,488 | 1,750 | 201 |
| Total Deaths | 3 | 56 | 41 | 76 | 118 | 235 | 252 | 205 | 84 | 1,070 |
| Deaths/100,000 | 0.1 | 2 | 7 | 15 | 23 | 66 | 133 | 256 | 344 | 10 |
| Deaths among cases | 0.05% | 1.6% | 3.3% | 4.6% | 4.8% | 8.6% | 13% | 17% | 20% | 5.0% |
Figure 19. Weekly number of deaths among influenza cases in Sweden, 2022–2023 to 2025–2026.
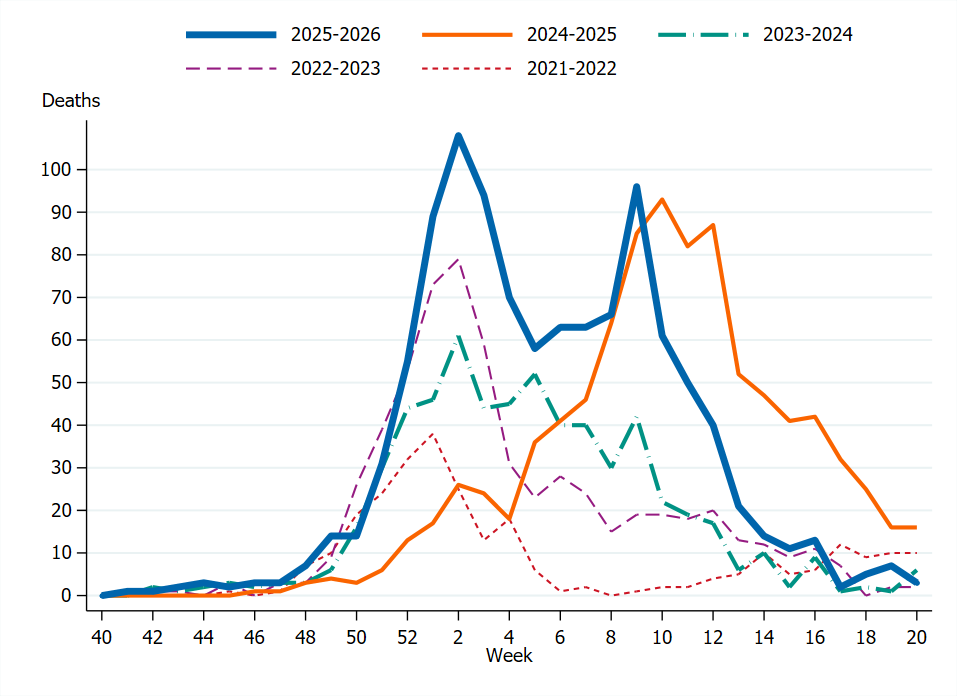
The PHAS monitors excess mortality through the EuroMOMO model, which estimates the crude excess mortality for the whole country by age group and regionally compared to baseline expected levels. Excess mortality during the winter may be related to a number of factors, including influenza and other respiratory infections or to periods of extremely cold temperatures.
Figure 20. Number of crude and expected (baseline) deaths per week in the age group 65 years and older, Sweden, 2019 (week 52) to 2026 (week 27).
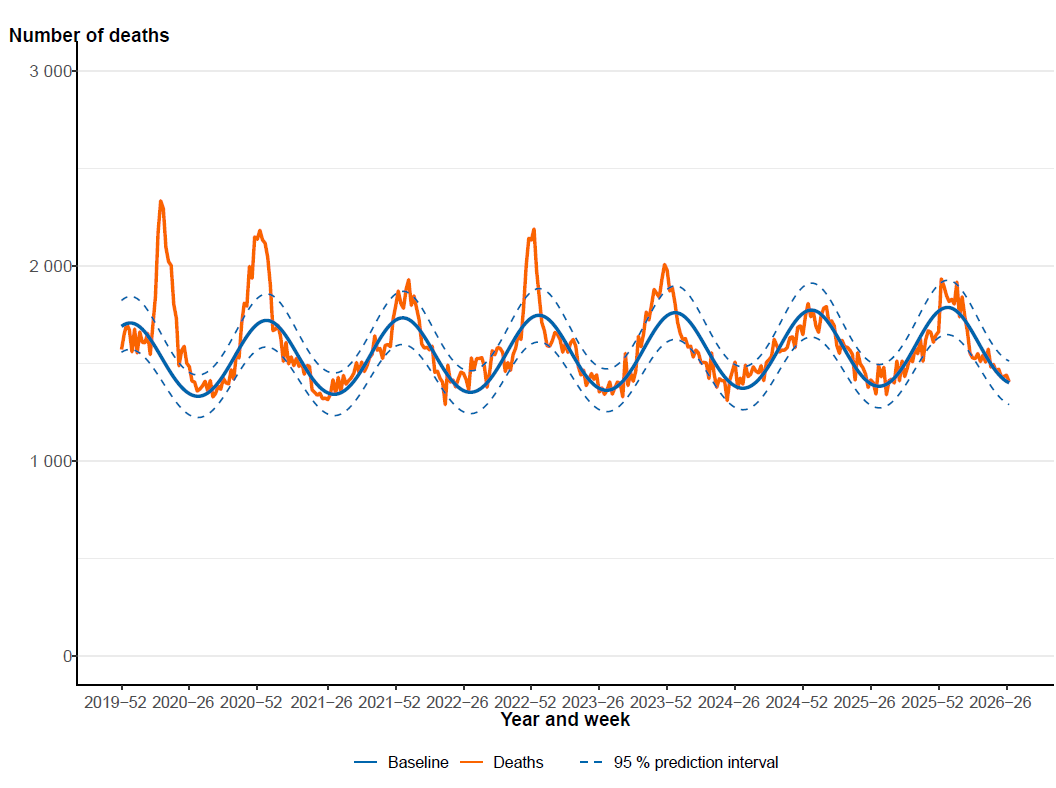
The darker line (figure 20) that follows an even, wave-like pattern is the expected (baseline) number of deaths with dashed lines showing the 95% confidence interval, while the more varying line is the actual number of deaths per week.
Vaccination coverage
There is no national register for influenza vaccinations in Sweden. Instead, the vaccination coverage is estimated among persons 65 years of age by each of Sweden’s 21 county medical officers for their respective regions (also known as county councils). Various methods for estimation have been used in different regions, see Comments on vaccination data.
Figure 21. Influenza vaccination coverage among persons aged 65 and older in Sweden, 2017–2018 to 2025–2026.
It is difficult to estimate influenza vaccination coverage among the medical risk groups under 65 years of age because these groups are hard to define and because data on risk group status is not usually collected. A subset of Swedish regions, accounting for approximately 80 percent of the total population, has reported data that enable the estimation of coverage per age group, see Table 12 and the section Comments on vaccination data.
| Age group | Population on 31 Dec. 2025 | Percentage vaccinated |
|---|---|---|
| 0–4 years | 412 105 | 0.4% |
| 5–17 years | 1 279 284 | 0.5% |
| 18–39 years | 2 328 517 | 3.0% |
| 40–64 years | 2 605 244 | 7.2% |
| 65–79 years | 1 241 638 | 60% |
| 80+ years | 550 250 | 79% |
| Total | 8 417 038 | 17% |
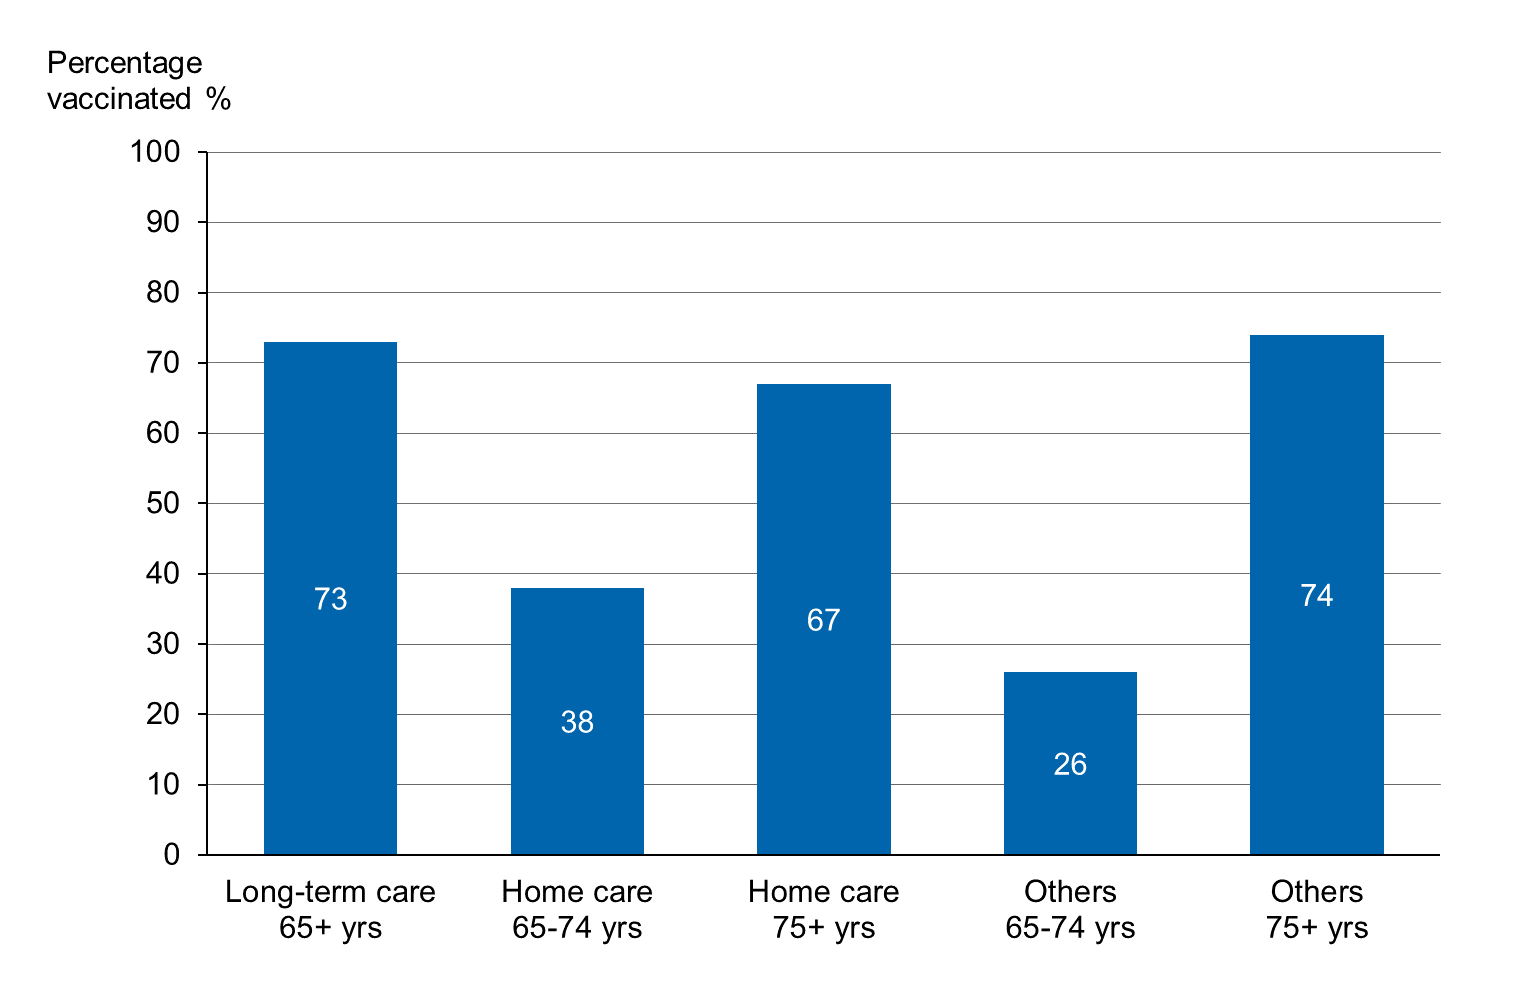
Figure 22. COVID-19 vaccination coverage among persons aged 65 and older in Sweden, by target group, autumn dose 2025–2026.
| Target group | Percentage vaccinated |
|---|---|
| Long-term care facilities for the elderly (65 years and older) | 73 |
| Home care services aged 65–74 years | 38 |
| Home care services aged 75 years or older | 67 |
| Other services aged 65–74 years | 26 |
| Other services aged 75 years or older | 74 |
Comments on vaccination data
Seasonal influenza vaccination is not included in Sweden’s national vaccination register. Various methods for estimating vaccination coverage among persons 65 years of age and older have been used in each of the 21 regions, including the use of regional vaccination registries, the number of vaccine doses given or distributed, sentinel reports on vaccination coverage, surveys among general practitioners, and patient record data. These methodological differences result in coverage estimates of varying quality and precision. Although the methods vary between regions, the methods within most regions have been roughly the same for the past several years, thus allowing a comparison over time.
Vaccination coverage estimates were calculated using the population data from December 31 of each year (Source: Statistics Sweden). Changes in data sources and data excluded per region are noted in the Swedish-language publication regarding vaccination coverage (8). For some regions, data sources do not include all doses given, e.g., doses given within municipal elderly care, at hospitals, or by private vaccination units. Data used to estimate the vaccination coverage by age group (see Table 12) includes data from all regions except Uppsala and Västra Götaland.
COVID-19 coverage is calculated using data from the national vaccination register (NVR) and includes doses administered from 1 September 2025 to 31 January 2026 (data extracted on 5 February, 2026). Age is based on year of birth. Data transfer from electronic health record systems to the NVR occurs fully or semi-automatically from each region. Denominator data are from Statistics Sweden (SCB) for August 2025.
References
- Public Health Agency of Sweden. Publikationer [Publications]. [Internet]. Stockholm: Public Health Agency of Sweden; 2026 [cited 2026-07-29] Available from: https://www.folkhalsomyndigheten.se/publikationer-och-material/publikationer/
- European Respiratory Virus Surveillance Summary (Erviss). [Internet.] Stockholm: European Centre for Disease Prevention and Control and Copenhagen: World Health Organisation – European region office; 2026 [cited 2026-07-26] Available from: https://erviss.org/
- EuroMOMO Reports and Publications, [Internet]. Denmark: Statens Serum Institut; 2026 [cited 2026-07-26] Available from: https://euromomo.eu/how-it-works/reports-and-publications
- Vaccine Effectiveness, Burden and Impact Studies (VEBIS). [Internet.] Stockholm: European Centre for Disease Prevention and Control; 2026 [cited 2026-06-23] Available from: https://www.ecdc.europa.eu/en/infectious-disease-topics/related-public-health-topics/immunisation-and-vaccines/vebis
- H Lucaccioni, DFP Marques, F Kirsebom,H-D Emborg et al. Influenza vaccine effectiveness from nine studies during drifted A(H3N2) subclade K predominance, Europe, September 2025 to January 2026. Euro Surveill. 2026; 31(7):pii=2600109. https://doi.org/10.2807/1560-7917.ES.2026.31.7.2600109
- European Centre for Disease Prevention and Control, Communicable disease threats report, week 29, 2026. [Published n.d, cited 2026-08-19]. Available from: https://www.ecdc.europa.eu/en/publications-and-data/monitoring/weekly-threats-reports
- World Health Organization, Recommended composition of influenza virus vaccines for use in the 2026–2027 northern hemisphere influenza season. [Internet]. Geneva: World Health Organization; 2026. [published 2026-02-28, cited 2026-07-27]. Available from: https://www.who.int/publications/m/item/recommended-composition-of-influenza-virus-vaccines-for-use-in-the-2026-2027-northern-hemisphere-influenza-season
- Public Health Agency of Sweden, Specialavsnitt vecka 20 2026: Vaccinationstäckning mot influensa [Special report on influenza vaccination coverage 2025-2026]. [Internet]. Stockholm: Public Health Agency of Sweden; 2026 [cited 2026-07-29] Available from: https://www.folkhalsomyndigheten.se/statistik-och-data/lagesrapporter/luftvagsvirus-lagesrapporter/arkiv-for-lagesrapporter-och-specialavsnitt-om-luftvagsvirus/sasong-2025-2026/lagesrapport-om-luftvagsvirus-vecka-20-2026/
Authors
AnnaSara Carnahan, Sara Eriksson, Neus Latorre-Margalef, Anna Ohlson, Viktor Persson, Henny Rydberg, Tove Samuelsson Hagey, Dorina Ujvari, Sarah Zanetti
Acknowledgements
We would like to especially thank all of the regional laboratories, hospitals, sentinel network participants in primary care, healthcare workers, and registry managers whose work and data have contributed to this report.
We thank our colleagues at the Department of Microbiology Nora Nid and Anna-Lena Hansen for sample analysis and virus isolation, as well as colleagues at the sequencing platform and the bioinformatics team.