Influenza in Sweden – Season 2024–2025
Summary
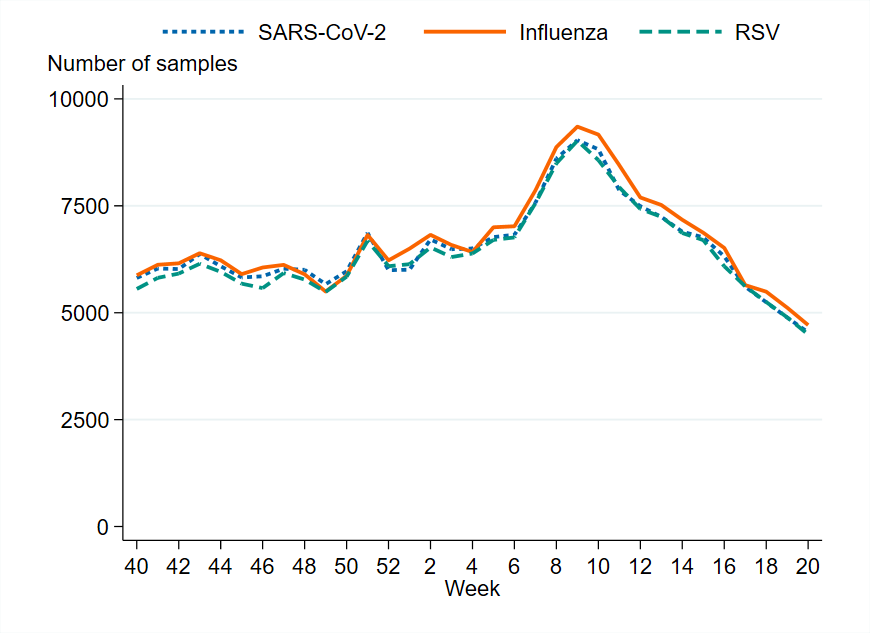
The 2024–2025 winter season was characterised by later epidemics of influenza and respiratory syncytial virus (RSV) compared to the previous three seasons and was more similar to winter seasons prior to the COVID-19 pandemic. The influenza peak occurred in weeks 8–10, during which influenza transmission was high and widespread throughout Sweden. A concurrent epidemic of RSV peaked in week 9, but at a lower intensity compared to recent RSV seasons. Transmission of COVID-19 was low during the autumn and winter, after a peak at the end of summer 2024, and was very low in the spring of 2025. As in the previous season, weekly testing rates were comparable for influenza, COVID-19, and RSV, enabling comparison of laboratory-based surveillance data.
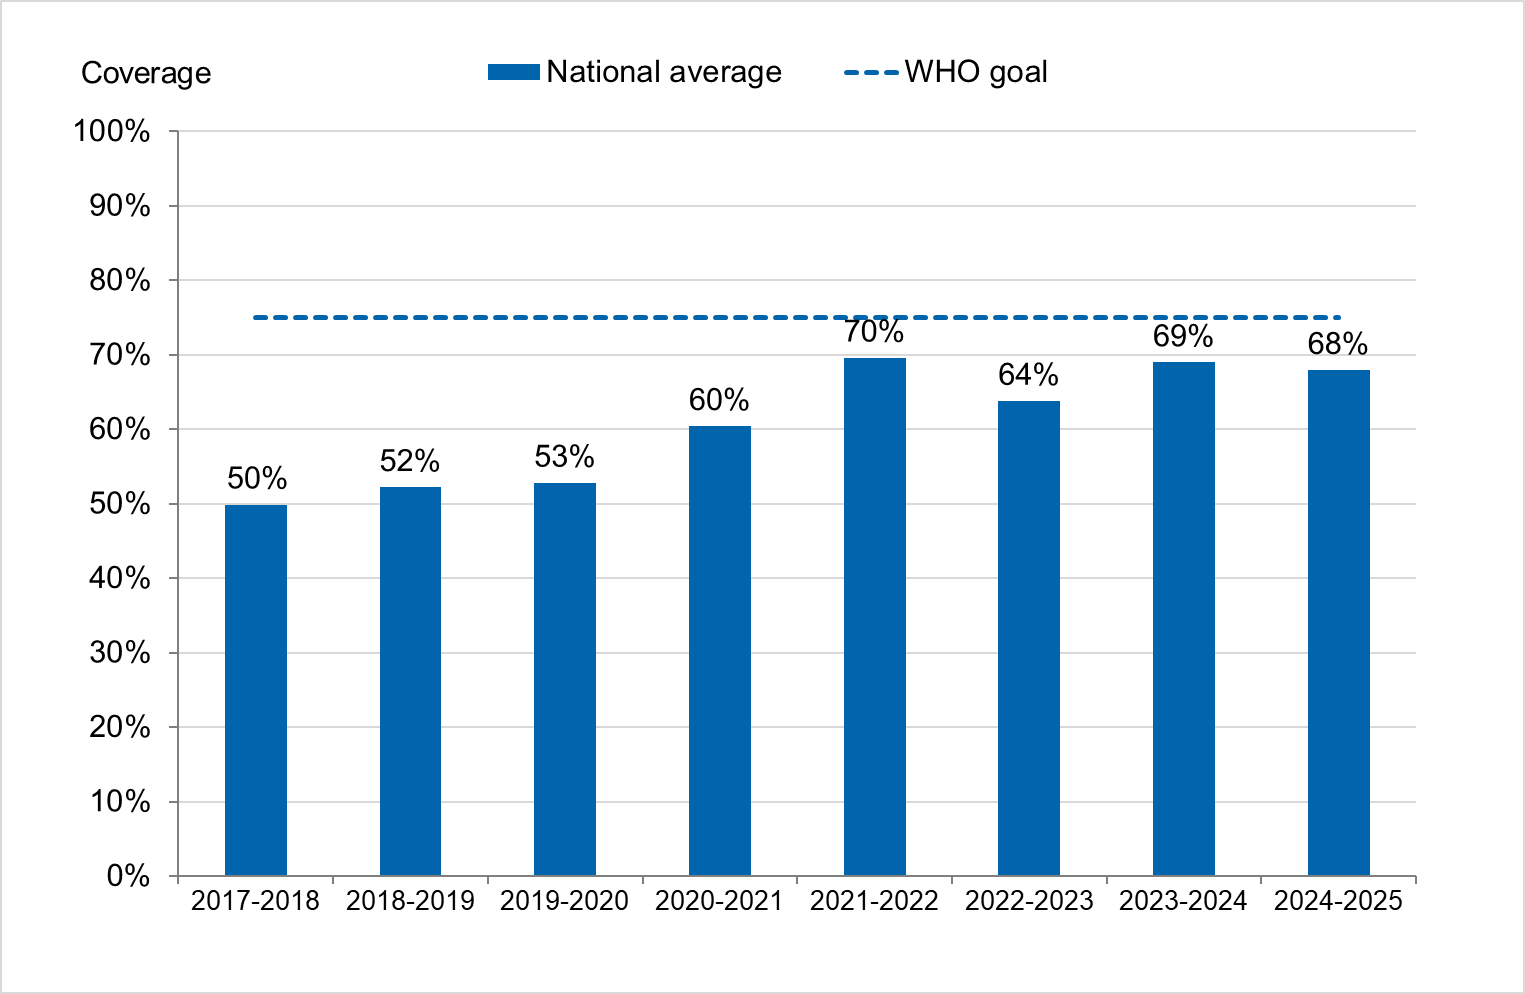
Vaccination coverage during 2024–2025 against influenza among persons aged 65 years or older was estimated at 68 percent, which is approximately as high as in the 2023–2024 and 2021–2022 seasons, and considerably higher than the seasons prior to the COVID-19 pandemic. All three seasons with high influenza vaccination coverage were seasons when co-administration of influenza and COVID-19 vaccination was offered. Vaccination coverage for influenza this season was therefore similar to coverage for COVID-19 in the same age group.
During the season, the highest notification rate of laboratory-confirmed influenza was seen in the age group 65 years and older, which was higher than the previous five epidemic seasons. Influenza-related deaths were higher than other seasonal peaks, but no excess mortality was measured. The number of cases in intensive care was comparable to the two previous seasons. The number of patients treated with extracorporeal membrane oxygenation (ECMO) (13 patients) was comparable to the 2023–2024 season (16 patients), but was higher compared to the four preceding seasons.
Based on data from laboratory reporting and sentinel surveillance, both influenza A and B circulated during the season, with 85 percent of reported cases being influenza A. Both influenza A and B reached their highest levels in weeks 8–10. Some geographic differences were seen during the season. Most notably, a second, lower peak of both influenza A and B was seen in the northern parts of the country in week 15, 2025, with activity continuing in some regions into the first weeks of summer.
Of the subtyped influenza A samples within laboratory reporting, approximately 64 percent were A(H1)pdm09 and 36 percent were A(H3), but from week 7 onwards the distribution was relatively even between the subtypes.
A selection of influenza-positive samples received from clinical microbiological laboratories and collected through sentinel surveillance were further characterised at the Public Health Agency of Sweden (PHAS). During the season, the HA gene of 283 virus isolates was characterised for genetic group affiliation:
- A(H3N2)-viruses: All of the analysed viruses belonged to subclade J.2 in genetic group 2a.3a.1, which has been found to be poorly recognised by ferret antisera raised against the vaccine strains in subclade J in the same genetic group, indicating a mismatch. The WHO has since updated the component for the southern hemisphere 2025 and northern hemisphere 2025–2026 vaccines to genetic group 2a.3a.1 (J.2).
- A(H1N1)pdm09-viruses: All the analysed viruses belonged to genetic group 5a.2a and 5a.2a.1, which are well recognised by ferret antisera raised against the vaccine strains (5a.2a.1).
- B/Victoria-viruses: All the characterised viruses belonged to genetic group V1A.3a.2, which is the same group as the vaccine strain.
Analysis of genetic markers associated with reduced susceptibility to the neuraminidase inhibitors oseltamivir and zanamivir, the endonuclease inhibitor baloxavir marboxil, and to amantadine was performed in the NA, PA, and M genes of 297, 280, and 257 influenza viruses, respectively. None of the viruses carried amino acid substitutions previously known to confer resistance to oseltamivir or zanamivir, while one virus carried an amino acid substitution associated with reduced inhibition by baloxavir marboxil. All Swedish influenza A viruses were resistant to amantadine. In summary, Swedish samples had low levels of resistance to currently used antivirals.
In April 2025, one case of infection with influenza A(H1N2) was detected within the sentinel surveillance system. The virus had a 7:1 genetic constellation with the neuraminidase gene from seasonal influenza A(H3N2) and the remaining genes from seasonal influenza A(H1N1)pdm09 (2).
Sammanfattning
Vintersäsongen 2024–2025 kännetecknades av senare epidemier av influensa och RS-virus, jämfört med de tre föregående säsongerna. Säsongen liknar därför mer vintersäsongerna före covid-19-pandemin. Influensatoppen inträffade under vecka 8–10, då smittspridningen var hög i hela Sverige. En samtidig epidemi av RS-virus nådde sin topp under vecka 9, men med en lägre intensitet jämfört med föregående tre säsonger. Spridningen av covid-19 hade en topp i slutet av sommaren 2024, men var låg under hösten och vintern, och mycket låg under våren 2025. Likt föregående säsong var provtagningen jämförbar för influensa, covid-19 och RS-virus, vilket gjorde det möjligt att jämföra laboratoriebaserade övervakningsdata.
Vaccinationstäckningen mot säsongsinfluensa bland personer 65 år och äldre var cirka 68 procent. Det är ungefär lika många personer som vaccinerades under säsongerna 2023–2024 och 2021–2022, och betydligt högre än under säsongerna före covid-19-pandemin. Under dessa tre säsonger erbjöds även samvaccination mot influensa och covid-19. Vaccinationstäckningen mot influensa under säsongen 2024–2025 var därför jämförbar med täckningen mot covid-19 i samma åldersgrupp.
Under säsongen 2024–2025 var antalet bekräftade fall av influensa högst bland personer 65 år eller äldre, och högre i denna åldersgrupp än under de fem föregående vintersäsongerna. Antalet dödsfall bland bekräftade fall var högre än vid andra säsongstoppar, men ingen överdödlighet uppmättes. Antalet patienter som intensivvårdades med influensainfektion var jämförbart med de två föregående säsongerna. Tretton patienter behandlades med ECMO (extrakorporeal membranoxygenering), vilket var jämförbart med föregående säsong (16 patienter), men högre än under de fyra säsongerna innan dess.
Data från laboratorierapporteringen och sentinelövervakningen visade att både influensa A och B cirkulerade under säsongen. Av de rapporterade fallen hade 85 procent influensa A. Både influensa A och B nådde de högsta nivåerna under vecka 8–10. Vissa geografiska skillnader sågs under säsongen. Mest anmärkningsvärt var en andra, lägre topp av influensa A och B i Norrland under vecka 15 och en influensaaktivitet som fortsatte in i de första sommarveckorna i vissa regioner.
Av de influensa A-prover som subtypades inom laboratorierapporteringen var cirka 64 procent influensa A(H1)pdm09 och 36 procent var A(H3). Från och med vecka 7 var fördelningen mellan subtyperna relativt jämn.
Ett urval influensapositiva prover från kliniska mikrobiolgoiska laboratorier och sentinelövervakningen analyseras vidare vid Folkhälsomyndigheten. Under säsongen karaktäriserades HA-genen hos 283 influensastammar för att undersöka vilken genetisk grupp de tillhörde:
- A(H3N2)-stammar: Alla analyserade stammar tillhörde subklad J.2 i den genetiska gruppen 2a.3a.1. Denna subklad skiljer sig antigeniskt från subklad J i samma genetiska grupp, som vaccinstammarna tillhör. Det tyder på en dålig matchning mellan vaccin och cirkulerande virus. WHO har sedan dess uppdaterat vaccinstammarna till subklad J.2 för södra halvklotet (säsongen 2025) och norra halvklotet (säsongen 2025–2026).
- A(H1N1)pdm09-stammar: Alla analyserade stammar från september 2024 och framåt tillhörde de genetiska grupperna 5a.2a och 5a.2a.1. Dessa stammar är väl igenkända av antisera mot vaccinstammarna i den genetiska gruppen 5a.2a.1, vilket innebär en god skyddseffekt mot cirkulerande stammar.
- B/Victoria-stammar: Alla cirkulerande stammar tillhörde den genetiska gruppen V1A.3a.2, samma grupp som vaccinstammen, vilket innebär en god skyddseffekt mot cirkulerande stammar.
En analys av genetiska markörer gjordes i NA-, PA- och M-generna hos 297, 280 respektive 257 influensastammar. Markörerna är associerade med en nedsatt känslighet för de antivirala substanserna oseltamivir och zanamivir (båda neuraminidashämmare), baloxavir marboxil (en endonukleashämmare) samt för amantadin. Analysen visade att inga virus bar på aminosyrasubstitutioner som leder till resistens mot oseltamivir eller zanamivir. Ett virus bar på en aminosyrasubstitution som är associerad med minskad känslighet för baloxavir marboxil. Alla svenska stammar var resistenta mot amantadin. Sammanfattningsvis hade de analyserade svenska stammarna en låg grad av resistens mot de antivirala substanser som används idag.
Under april 2025 upptäcktes ett reassortant fall av influensa A(H1N2) inom sentinelövervakningen. Viruset hade en 7:1 genetisk konstellation och innehöll neuraminidasgenen från säsongsinfluensa från A(H3N2) och övriga gener från säsongsinfluensa A(H1N1)pdm09 (2).
About this publication
This report describes the monitoring and surveillance systems for influenza in use during the 2024–2025 winter season and the results of both epidemiological and virological surveillance. Data are also compared to previous influenza seasons. See also the tables and figures section as well as the appendices.
The report was prepared for the World Health Organization (WHO) as part of the Public Health Agency of Sweden’s function as a National Influenza Centre (NIC).
Annual reports in English about the influenza seasons in Sweden are published yearly. The most recent reports can be found on the Public Health Agency’s website (suggested search “Influenza in Sweden”) (1).
Public Health Agency of Sweden
Sara Byfors
Head of Department, Department of Microbiology
Lennie Lindberg
Head of Department, Department of Communicable Disease Control and Health Protection
Epidemiological data
Respiratory viruses overview in Sweden during the 2024–2025 season
The 2024–2025 winter season was characterised by later epidemics of influenza and respiratory syncytial virus (RSV) compared to the previous three seasons and was more similar to the winter seasons prior to the COVID-19 pandemic. The influenza epidemic began in December with a high intensity peak of influenza A and B at the end of February and early March.
The RSV season began with a slow increase during December, and the epidemic began in early January (week 1), reaching a peak at the end of February (week 9) at medium intensity compared to previous seasons. As usual, infants had the highest notification rate of laboratory-confirmed RSV infection compared to other age groups.
Transmission of COVID-19 was low during the autumn and winter after a peak at the end of summer 2024 and was very low in the spring of 2025. No winter epidemic of COVID-19 occurred. The number of laboratory-confirmed cases, patients in intensive care, and deaths among COVID-19 cases were lower in 2024 compared to the previous three years.
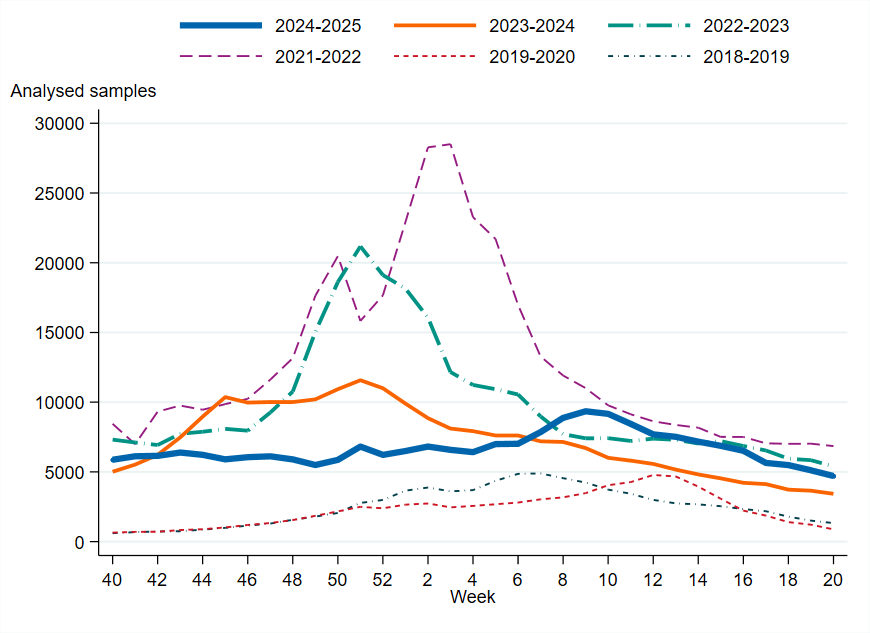
As in the previous season, approximately as many samples were analysed each week for influenza A and B as for SARS-CoV-2 and RSV, largely because many samples are analysed simultaneously for these pathogens by multiplex-PCR systems. Sampling has been lower from 2023–2024 onwards compared with the period from 2020 to 2022, when sampling was affected by the COVID-19 pandemic, but has been higher than the period before the COVID-19 pandemic.
Intensity levels and epidemic thresholds for influenza and RSV for the 2024–2025 season were assessed based on a combination of seasons before and after the pandemic period (2016–2017, 2017–2018, 2018–2019, 2022–2023, and 2023–2024), and this is in line with ECDC thresholds in the European Respiratory Virus Surveillance Summary (Erviss) (3).
Testing for influenza
From week 40, 2024, to week 20, 2025, approximately 220,000 samples were analysed for influenza, which is comparable to the previous season. The highest weekly testing during the 2024–2025 season was during the influenza peak. In contrast, the peak of testing during the previous season coincided with the peak of COVID-19 cases, which occurred several weeks prior to the influenza peak. Since most samples are analysed simultaneously for influenza, SARS-CoV-2 and RSV, testing and positivity rates for influenza are also affected by the epidemic activity of the other two viruses.
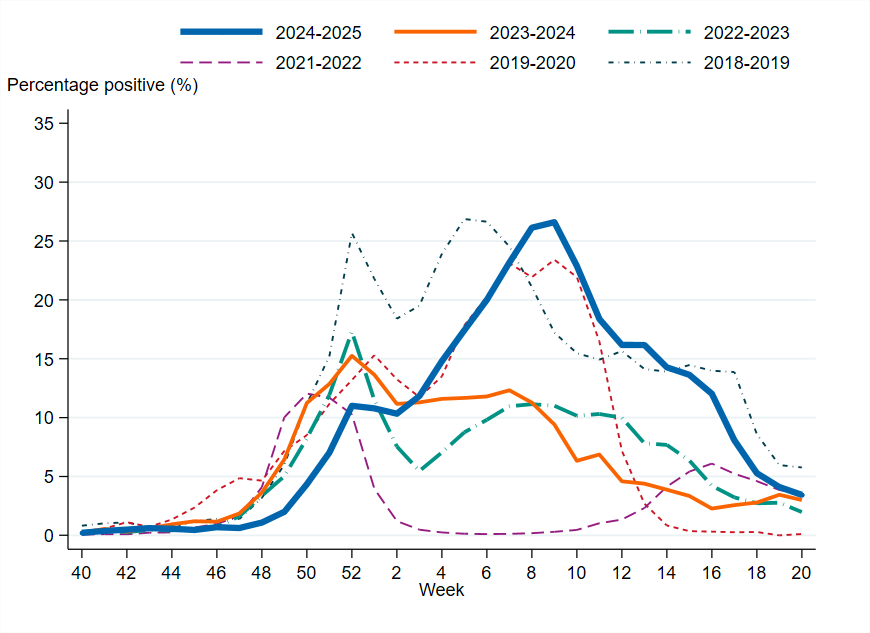
Overall, 11 percent of the samples taken during the 2024–2025 season were positive for influenza, which was higher than the three previous seasons but was still lower compared to seasons prior to the COVID-19 pandemic. The highest percentage of positive samples (27 percent) was observed in week 9, which was significantly higher than the previous season’s peak of 15 percent.
Laboratory-confirmed influenza cases
In total, 24,206 laboratory-confirmed influenza cases were reported during the 2024–2025 season (week 40, 2024 – week 20, 2025), of which 85 percent were influenza A and 15 percent were influenza B. Influenza A(H1)pdm09 dominated among influenza A cases in the beginning of the season, but from week 7 onwards the distribution was relatively even between the two influenza A subtypes, see the section Subtyping and lineage determination.
The epidemic started in week 50 based on epidemic threshold calculations. The influenza peak occurred in weeks 8–10, during which influenza transmission was high, with over 2,000 cases reported per week. The start of the epidemic was later than in the three previous seasons, when the peaks occurred in December. From week 10 onward, the number of both influenza A and B laboratory-confirmed cases started to decrease, but the intensity remained at a medium level until week 13. The influenza epidemic ended in week 20 on the national level but continued in some regions, see the section Geographic distribution of cases. Sporadic cases continued to be reported throughout the summer.
Age and sex distribution of cases
This season there was a higher notification rate of laboratory-confirmed influenza (per 100,000 population) in all age groups compared to the previous season. Overall, the highest weekly and cumulative notification rate of laboratory-confirmed influenza and specifically of influenza A was seen among persons aged 65 years and older, followed by children aged 0–4 years, which is the expected pattern. These age groups are typically most affected by severe illness in an influenza epidemic and are more often tested for influenza. Of laboratory-confirmed influenza B, the highest weekly and cumulative notification rate was seen among children aged 0–4 years, followed by persons aged 5–14 years.
The median age for reported cases of influenza A and B was 66 and 30 years, respectively. Slightly more women (52 percent) than men had laboratory-confirmed influenza.
Geographic distribution of cases
From week 49, 2024, to week 5, 2025, the highest weekly notification rate (per 100,000 population) of influenza was observed in the central parts of Sweden (Svealand). Between week 6 and week 13, 2025, the central and northern parts of Sweden (Svealand and Norrland) had similar notification rates, which were higher than in the southern parts (Götaland) and peaked in week 9, 2025. The peak in Götaland occurred in the same week but was lower than in Norrland and Svealand. By week 15, 2025, a second lower peak was observed in Norrland. Regional influenza activity continued to be reported into the early weeks of summer in Norrland.
Influenza cases in intensive care
A total of 338 patients in intensive care with laboratory-confirmed influenza were reported during the season, of which 301 had influenza A (89 percent). Among the 130 influenza A samples that were subtyped, 72 percent were influenza A(H1)pdm09 and 27 percent were influenza A(H3). One case was subtyped as both A(H1)pdm09 and A(H3). The total number of patients admitted to intensive care during the season was comparable to the two previous seasons, with similar overall levels, although the peak occurred later this season.
The median age of patients with influenza admitted to intensive care during the 2024–2025 season was 60 years, and 52 percent were men. The highest incidence of intensive care admissions per 100,000 population was observed among persons aged 65 years or older, followed by those aged 40–64 years, and then children aged 0–4 years. Nearly all patients aged 65 years or older who received intensive care had influenza A.
Among all patients, 68 percent belonged to a risk group for severe disease due to age (65 year or older) or underlying medical conditions. Among patients under 65 years of age, 49 percent belonged to a risk group for severe disease due to underlying medical conditions. The most common risk groups were chronic lung disease, chronic heart disease, diabetes, and immunodeficiency. Three patients were pregnant. There were 38 patients under the age of 18, of whom 34 percent belonged to a risk group for severe disease.
During the season, 13 patients received ECMO treatment, of whom ten had influenza A and three had influenza B. In total, ten of these patients’ samples were analysed for subtype/lineage, of which seven were influenza A(H1)pdm09, two were influenza A(H3), and the remaining one was B/Victoria. The median age among people treated with ECMO was 43 years (range <5 to 65 years>, and the sex distribution was even. Five of the 13 patients belonged to a risk group for severe disease.
Between the 2019–2020 and 2022–2023 seasons, between zero and seven patients per season were reported to have been treated with ECMO. During the high-intensity 2017–2018 season, when influenza B/Yamagata accounted for the majority of cases, 15 people were treated with ECMO. The number of patients treated with ECMO in this season was comparable to the 2023–2024 season, when 16 patients received ECMO treatment. That season’s high number was mainly attributed to an unusually high number of severe influenza cases who were also affected by secondary bacterial infections with invasive group A streptococci. This season, additional factors likely contributed to the high number of patients, such as higher capacity for admitting patients and lower perceived barriers for initiating contact with the ECMO team.
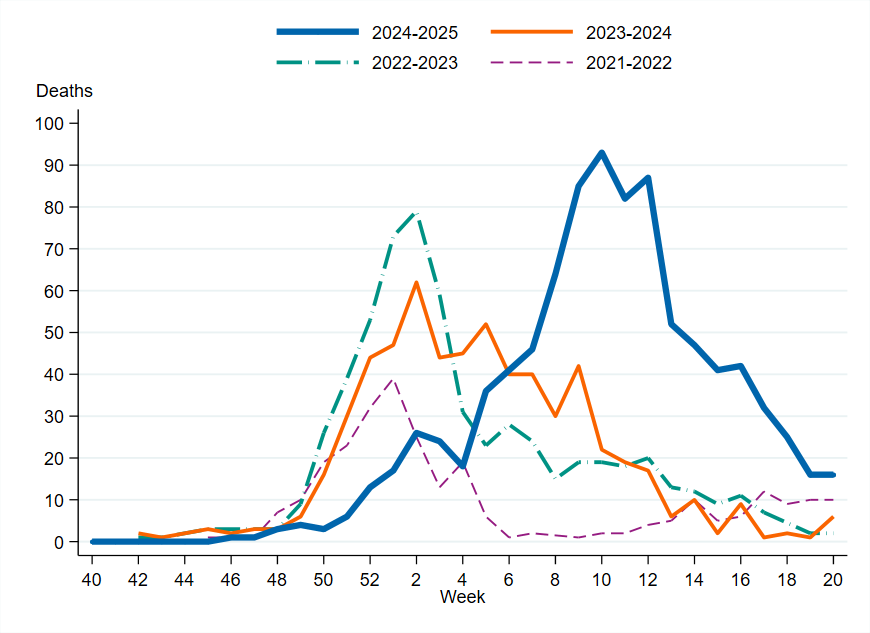
Influenza-related mortality
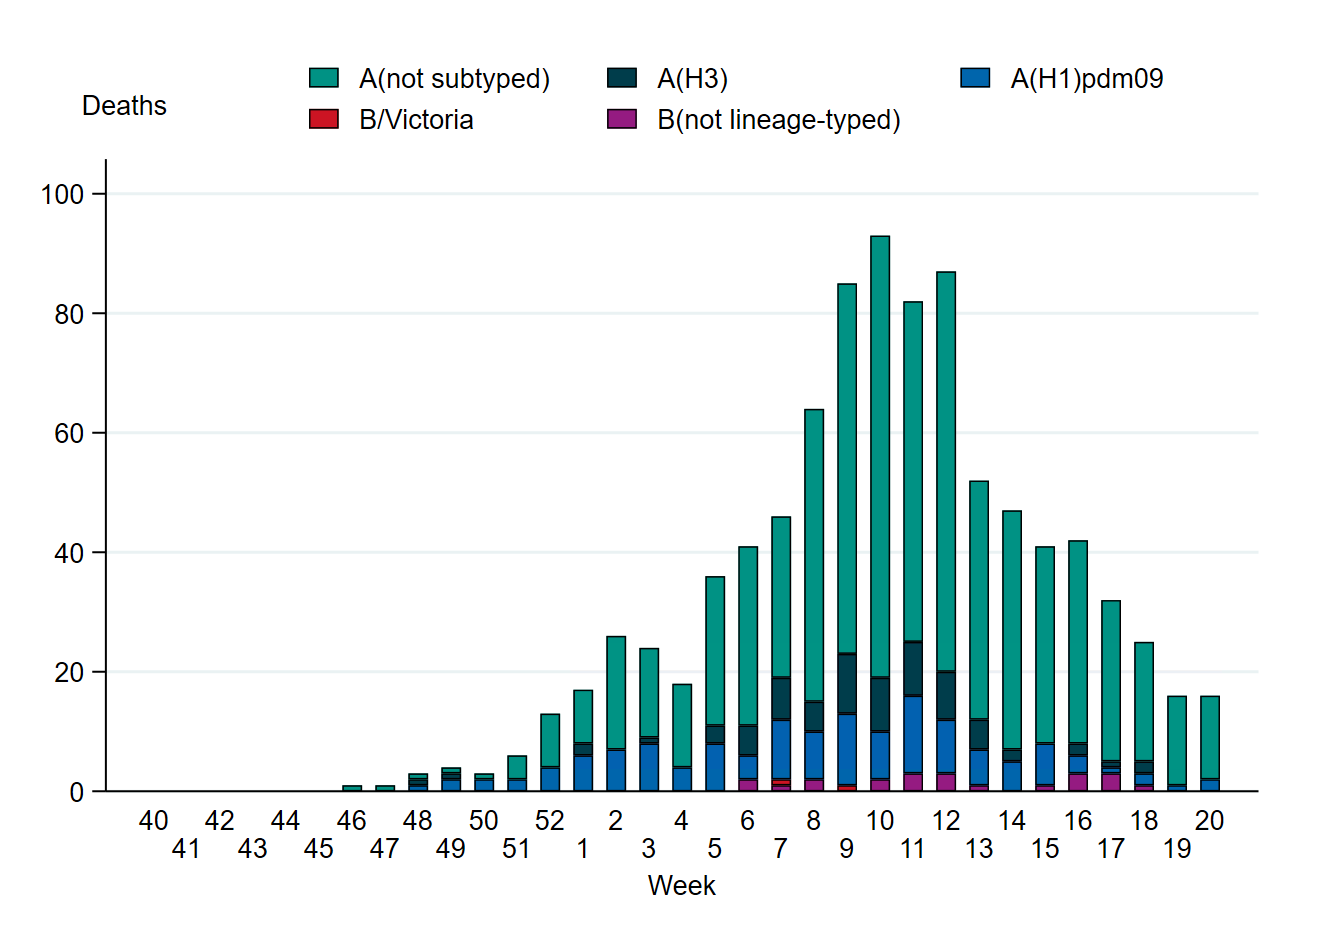
A total of 932 confirmed cases were reported to have died within 30 days of influenza diagnosis, of which 97 percent had influenza A. Among the 208 influenza A samples that were subtyped from patients who died, 66 percent were influenza A(H1)pdm09 and 34 percent were influenza A(H3).
The median age of those who died was 82 years, and 91 percent were 65 years and older. Among persons aged 65 years and older with laboratory-confirmed influenza A, approximately 8 percent died within 30 days. Slightly more men than women died within 30 days of an influenza diagnosis (53 percent of the deaths were among men). The weekly number of deaths was highest in week 10, 2025, with 93 deaths. Among all influenza cases, 4 percent died within 30 days of diagnosis. Compared with the previous three seasons, the peak of deaths was higher and lasted longer.
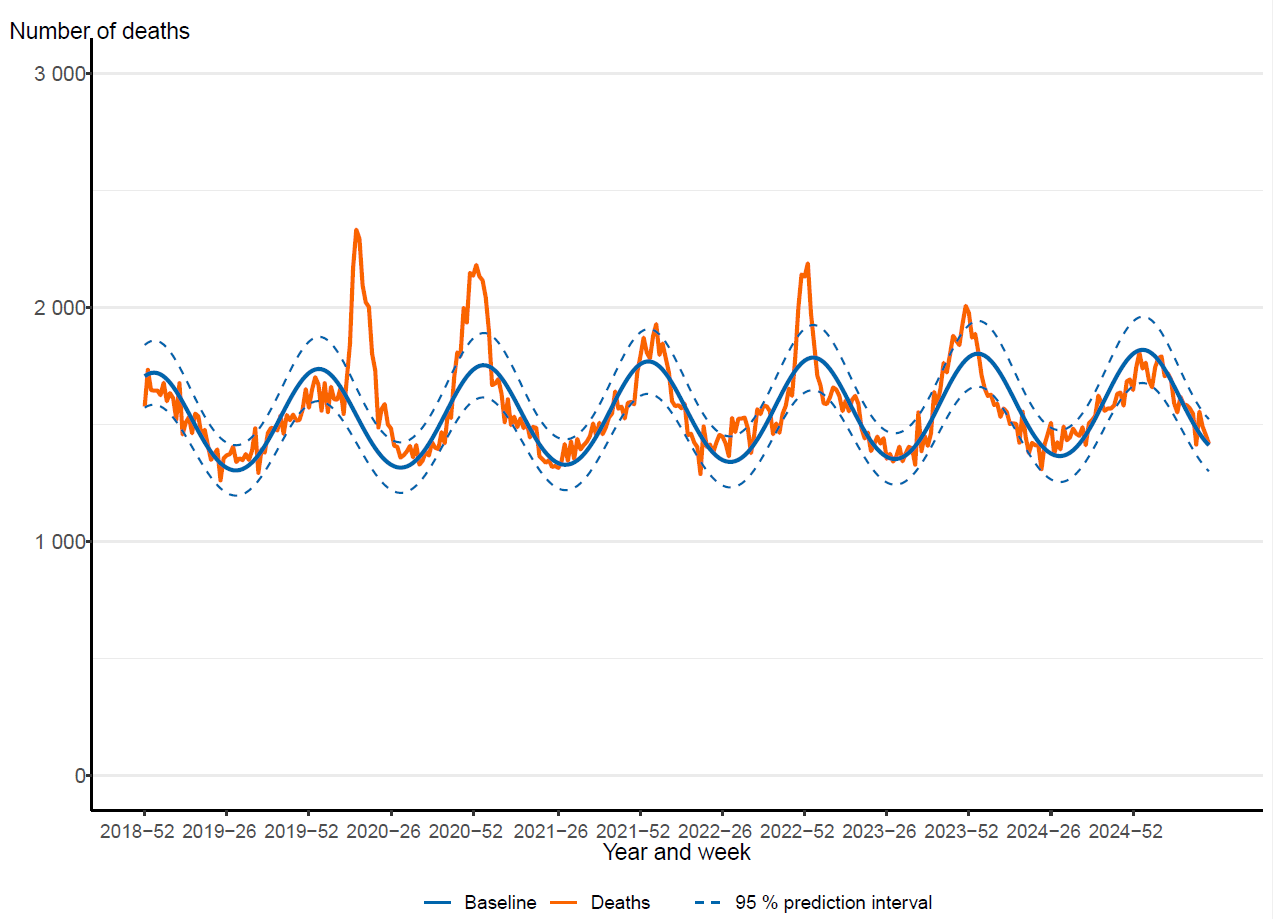
The PHAS monitors all-cause excess mortality nationally, per age group, and by region through the EuroMOMO model (4). This model indicated no significant excess mortality at the national level during the seasonal peak, despite the high influenza mortality.
Sentinel surveillance
In the 2024–2025 season, 33 general practitioner sites participated in sentinel surveillance. In total, 167 of 829 sentinel samples were positive for influenza (20 percent). Of these, 130 were influenza A (78 percent) and the remaining 37 samples were influenza B/Victoria (22 percent). Of the influenza A positives, 65 percent were influenza A(H1)pdm09 and 34 percent were influenza A(H3). A few influenza A-positive samples were not subtyped due to low viral load. Two coinfections of influenza A and RSV-A were detected. One coinfection of influenza B and RSV-B was detected.
According to laboratory-based surveillance, the onset of the influenza epidemic was identified in week 50, with sentinel surveillance showing comparable patterns. The number of sampled patients within sentinel surveillance was relatively stable from weeks 41 to 51, during which COVID-19 was circulating at slightly higher levels, and this was followed by a period of increased week-to-week fluctuation as the season progressed. The most significant peak in sampling occurred in week 8, coinciding with the highest number of influenza positive samples recorded.
Among the 829 patients sampled, 83 percent exhibited influenza-like illness (ILI), while 17 percent had acute respiratory illness (ARI). During the season as a whole, 19 percent of sentinel samples were obtained from patients aged 65 years or older. Among sampled patients in this age group for whom vaccination status was reported (147 patients), 46 percent had received influenza vaccination.
Data collected from the sentinel program in Sweden contributes to vaccine effectiveness studies for influenza and COVID-19 at the European level coordinated by the VEBIS network (Vaccine Effectiveness, Burden and Impact Studies) (5).
Influenza vaccination
Vaccination against influenza and COVID-19 for those aged 65 years and above as well as adults with medical risk factors, including pregnancy, began on October 15, 2025. Mainly quadrivalent standard-dose vaccines were used for the general population, while high-dose vaccines were used in long-term care facilities. Concomitant vaccine administration against influenza and COVID-19 was offered, with the goal of simplifying practical aspects for target groups and thereby increasing vaccination coverage for both vaccines. Groups recommended only influenza vaccination, including healthcare workers and children in risk groups, were vaccinated beginning about three weeks later, in early November.
Influenza vaccination coverage among persons aged 65 years and above was estimated at 68 percent, which is approximately as high as in the 2023–2024 and 2021–2022 seasons, during which concomitant vaccinations were offered. The vaccination coverage was considerably higher than in the seasons before the COVID-19 pandemic. Coverage was highest among people aged 80 years and above at 81 percent, followed by those aged 65–79 years at 61 percent.
It is difficult to estimate vaccination coverage among the medical risk groups under 65 years of age because these groups are hard to define and data on risk group status are not usually collected. In addition, influenza vaccinations are not included in the national vaccination register. Based on the available data, coverage among people under 65 years of age was approximately 4 percent, which is similar to previous seasons.
Virus characterisation
Subtyping and lineage determination
All diagnostic laboratories perform influenza typing using molecular assays for influenza A and B, and some perform subtyping of influenza A. The PHAS performs subtyping and lineage typing by real-time PCR for all samples received from the Swedish clinical microbiological laboratories and on all positive samples from sentinel surveillance as part of the national microbiological surveillance program.
In total, 5,140 influenza A-positive samples from laboratories in Sweden were subtyped during the season, comprising approximately 25 percent of all laboratory-confirmed cases of influenza A. Of the subtyped samples, 3,282 (64 percent) were A(H1)pdm09 and 1,849 (36 percent) were A(H3). Nine subtyped samples were reported as both influenza A(H3) and A(H1)pdm09, indicating co-infections. Subtype A(H1)pdm09 dominated in the beginning of the season, but from week 7 onwards the distribution was relatively even between the two influenza A subtypes. In the sentinel surveillance in primary care, 127 influenza A-positive samples were subtyped, of which 65 percent were influenza A(H1)pdm09 and 35 percent were A(H3).
The lineage was determined for 233 influenza B-positive samples, and all belonged to the B/Victoria lineage. The subtype and lineage of influenza-positive samples from sentinel and laboratory reporting systems are presented in the tables and figures section of this report.
During the summers of 2024 and 2025, increased subtyping of out-of-season influenza A-cases was conducted in accordance with recommendations from the ECDC for surveillance of zoonotic influenza. No zoonotic origin strains, including A(H5), have yet been detected.
Genotypic characterisation
A subset of influenza-positive samples, sourced from both clinical microbiological laboratories and from sentinel surveillance, was genetically characterised through whole genome sequencing (WGS on an Ion Torrent platform) as part of the national microbiological surveillance program. Samples were selected to be as representative as possible in terms of geographical location, period of collection, and type/subtype/lineage. The Swedish laboratories were also requested to submit influenza-positive samples to the PHAS from patients with severe or fatal outcomes, vaccine break-through infections, and those unresponsive to antiviral treatment. These samples all underwent further characterisation provided that the viral load was sufficient. Genetic characterisation and virus isolation was usually successful for samples with a real-time PCR Ct-value of 30 or lower.
The hemagglutinin (HA) gene was further analysed and was affiliated to genetic groups in accordance with ECDC influenza characterisation guidelines. In addition, the regions of the HA gene targeted by the subtype/lineage-specific real-time PCR systems used at the PHAS were analysed for sequence mismatches compared to primers and probes used in these systems. The neuraminidase (NA) gene was analysed with respect to amino acid substitutions previously associated with reduced or highly reduced inhibition by the NA inhibitors oseltamivir and zanamivir. The PA gene was analysed with respect to amino acid substitutions previously associated with a >3-fold increase in IC50 value for baloxavir marboxil. The matrix gene of influenza A viruses was analysed with respect to amino acid substitutions previously linked to resistance to amantadine. The segments of the matrix gene sequences of influenza A and B which serve as targets in the real-time PCR systems used for detection of influenza at the PHAS were analysed for mismatches to the PCR primers and probes.
A representative selection of the isolated virus samples was sent to the World Health Organization Collaboration Centre (WHOCC) in London for antigenic characterisation and for phenotypic analysis of susceptibility to NA inhibitors using the NA inhibition assay.
Characterisation data were continuously reported to the ECDC via The European Surveillance System (TESSy), and sequence data are continuously uploaded to the Global Initiative on Sharing All Influenza Data (GISAID).
Genetic groups
The genetic group and subclade of the 283 characterised Swedish influenza A and B viruses from the 2024–2025 season are shown in Tables 1, 2, and 3 by influenza subtype or lineage and in the phylogenetic trees in Appendices 1–3. Of the characterised viruses, 152 were subtype A(H1N1)pdm09, 75 were subtype A(H3N2), and 56 were lineage type B/Victoria.
No antigenic analyses were performed at the PHAS. The general antigenic properties of the genetic groups have, however, been summarised in the report by the WHO in conjunction with the influenza vaccine composition recommendation meeting for the northern hemisphere 2025–2026 held in February 2025 (7). The antigenic analyses with ferret antisera raised against the respective vaccine strains included in the northern hemisphere vaccine for 2024–2025 are described in the following sections.
Influenza A(H1N1)pdm09
Globally circulating influenza A(H1N1)pdm09-viruses since September 2024 have all belonged to genetic groups 5a.2a and 5a.2a.1. All analysed Swedish virus isolates belonged to subclades C.1.9 and C.1.9.3 within genetic group 5a.2a and to subclades D and D.3 within genetic group 5a.2a.1, see Table 1.
The dominant subclade among viruses reported within the European surveillance until week 20, 2024, was C.1.9 within the 5a.2a genetic group (6). Ferret antisera raised against the egg-propagated vaccine strain A/Victoria/4897/2022 or the cell-propagated vaccine strain A/Wisconsin/67/2022, belonging to subclade D and subclade C.1.1, respectively, within genetic group 5a.2a, reacted well to the circulating subclades. Recommended vaccine viruses for the northern hemisphere 2025–2026 season are unchanged from the 2024–2025 season (7, 8).
| Genetic group (Subclade) | Representative strain | Number of viruses (Percentage of viruses) |
|---|---|---|
| 5a.2a (C.1) | A/Sydney/5/2021 | 0 (0 %) |
| 5a.2a (C.1) | A/Netherlands/10468/2023 | 0 (0 %) |
| 5a.2a (C.1.8) | A/Michigan/62/2023 | 0 (0 %) |
| 5a.2a (C.1.9) | A/Lisboa/188/2023 | 20 (13 %) |
| 5a.2a (C.1.9.3) | A/Hungary/286/2024 | 100 (66 %) |
| 5a.2a.1 (D) | A/Victoria/4897/2022 | 2 (1 %) |
| 5a.2a.1 (D.3) | A/Norway/00926/2025 | 30 (20 %) |
Influenza A(H3N2)
Globally circulating influenza A(H3N2)-viruses since September 2024 belonged to genetic group 2a.3a.1. All analysed Swedish virus isolates also belonged to group 2a.3a.1, subclades J.2, J.2+N158K+K189R, J.2.1 and J.2.2, see Table 2.
The dominant subclade among viruses reported within the European surveillance until week 20, 2025, was J.2 within the 2a.3a.1 genetic group (6). Ferret antisera raised against viruses similar to the northern hemisphere 2024–2025 vaccine strain A/Thailand/8/2022 or A/Massachusetts/18/2022 (subclade J within genetic group 2a.3a.1) show reduced reactivity to the vast majority of viruses tested. These results have been confirmed by human serology studies. Therefore, vaccine strains for A(H3N2) have been updated for the egg-propagated vaccine strain to A/Croatia/10136RV/2023 and for the cell-propagated vaccine strain to A/District of Columbia/27/2023 for the southern hemisphere 2025 and the northern hemisphere 2025–2026 season (8). Both of these vaccine strains belong to subclade J.2 within genetic group 2a.3a.1.
| Genetic group (Subclade) | Representative strain | Number of viruses (Percentage of viruses) |
|---|---|---|
| 2a | A/Darwin/9/2021 | 0 (0 %) |
| 2a.3a.1 (J) | A/Thailand/8/2022 | 0 (0 %) |
| 2a.3a.1 (J.1) | A/Sydney/856/2023 | 0 (0 %) |
| 2a.3a.1 (J.2) | A/Croatia/10136RV/2023 | 48 (64 %) |
| 2a.3a.1 (J.2) + N158K +K189R | A/Netherlands/10685/2024 | 1 (1 %) |
| 2a.3a.1 (J.2.1) | A/West Virginia/51/2024 | 6 (8 %) |
| 2a.3a.1 (J.2.2) | A/Lisboa/216/2023 | 20 (27 %) |
| 2a.3a.1 (J.4) | A/France/IDF-IPP29542/2023 | 0 (0 %) |
Reassortant A(H1N2)
In April 2025, one case of infection with influenza A(H1N2) was detected in a patient who sought primary care with influenza-like illness and was sampled as a part of sentinel surveillance. The virus had a 7:1 genetic constellation with the neuraminidase gene from seasonal influenza A(H3N2) and the remaining genes from seasonal influenza A(H1N1)pdm09. The patient recovered and no additional cases have been detected (2).
Influenza B/Victoria
Globally circulating B/Victoria lineage viruses belonged to genetic group V1A.3a.2. All analysed Swedish virus isolates also belonged to genetic group V1A.3a.2, subclades C.5, C.5.1, C.5.6 and C.5.7.
The dominant subclade among viruses reported within the European surveillance until week 20, 2025, was C.5.1 within genetic group V1A.3a.2 (6). Viruses in genetic group V1A.3a.2 were recognised well by antisera raised against the vaccine strain B/Austria/1359417/2021 (clade C within genetic group V1A.3a.2), and these results have been confirmed by human serology studies. Therefore, the recommended vaccine strain for the northern hemisphere 2025–2026 season is unchanged from the 2024–2025 season (8).
| Genetic group (Subclade) | Representative strain | Number of viruses (Percentage of viruses) |
|---|---|---|
| V1A.3 | B/Washington/02/2019 | 0 (0%) |
| V1A.3a.2 (C) | B/Austria/1359417/2021 | 0 (0%) |
| V1A.3a.2 (C.5) | B/Stockholm/3/2022 | 3 (5%) |
| V1A.3a.2 (C.5.1) | B/Catalonia/2279261NS/2023 | 12 (21%) |
| V1A.3a.2 (C.5.6) | B/Switzerland/329/2024 | 19 (34%) |
| V1A.3a.2 (C.5.7) | B/Guangxi-Beiliu/2298/2023 | 22 (39%) |
Influenza B/Yamagata
No B/Yamagata strains have been confirmed among positive influenza samples in Sweden or globally during the 2024–2025 season. Influenza B/Yamagata circulation has not been detected globally since 2020.
Antiviral susceptibility
The NA gene of 166 influenza A(H3N2), 77 influenza A(H1N1)pdm09, and 54 influenza B/Victoria viruses was sequenced and analysed for amino acid substitutions previously shown to be associated with reduced or highly reduced inhibition by the NA inhibitors oseltamivir and zanamivir. No amino acid substitutions associated with reduced or highly reduced inhibition of oseltamivir or zanamivir were detected. Additional phenotypic results are pending from the WHOCC.
In total, the PA gene was sequenced and analysed for 75 influenza A(H3N2), 205 A(H1N1)pdm09, and 49 B/Victoria viruses. Of these, one A(H1N1)pdm09 virus exhibited an amino acid substitution (E199G) associated with reduced inhibition by baloxavir marboxil. No other amino acid substitutions associated with inhibition by baloxavir marboxil were found.
The amino acid substitution S31N in the matrix protein, which confers resistance to amantadine, was present in all 257 Swedish influenza A viruses (79 A(H3N2) and 178 A(H1N1)pdm09 viruses). Additional amino acid substitutions associated with resistance to amantadine were observed in 16 influenza A(H1N1)pdm09 viruses. Amino acid substitutions L26F, V27I, and V27A were carried by ten, three, and three viruses, respectively.
Virus isolation in cell culture
A subset of influenza-positive samples was cultured and isolated using MDCK-SIAT1 cells. Sample selection was based on similar criteria as for the genetic characterisation described earlier. A subset of the sequenced samples were chosen for isolation. Inactivated samples and samples with low viral load (Ct-value more than 30) were not included. A total of 40 viruses (12 A(H3N2), 20 A(H1N1)pdm09, and 8 B/Victoria viruses) were successfully isolated in MDCK-SIAT1 cells. Of these, 40 virus isolates along with 40 matching clinical samples were sent to the WHOCC London for further characterisation.
Quality assessment
External quality assessment programmes provide a comparison of method performance between laboratories and serve as a tool to ensure the accuracy of laboratory testing. The PHAS takes part in several external programmes and produces a panel for other Swedish laboratories. Surveillance is dependent on such standardised methods.
At the PHAS, one-step real-time RT-PCR assays are employed to detect influenza A and B, to subtype influenza A-positive samples, and to discriminate between the two influenza B lineages. These assays have also been optimised, implemented, and evaluated for avian influenza diagnostics. The importance of these assays lies in their sensitivity, rapidity, and scalability. The PHAS continuously monitors the genomic sequences of circulating influenza strains in order to detect mutations that might impact the sensitivity of the PCR assays. The PHAS also performs in silico (computational) validation of each assay annually before the peak of the influenza season.
Each year, the PHAS produces a PCR panel for Swedish laboratories on behalf of the External Quality Assessment for Clinical Laboratory Investigations (EQUALIS). This allows laboratories to measure the analytical sensitivity and specificity of their methods. The majority of the laboratories performing diagnostics for influenza use commercial PCR kits. A number of these laboratories participate in additional quality controls during the season in order to ensure that circulating influenza strains can be detected with these kits.
National quality assessment programme for influenza PCR
In September 2024 the PHAS produced a new PCR panel for Swedish laboratories, which was distributed by EQUALIS. Twenty-one laboratories participated in the panel that included ten samples in total: six influenza A and three influenza B (the cycle threshold value range was 25–35 when analysed with the in-house PCR method at the PHAS), as well as one negative control sample. All laboratories reported 10/10 correct results.
In the event of methodological issues with clinical samples, Swedish clinical microbiological laboratories are welcome to contact the PHAS to compare their results or to obtain sequence data for further investigation. This service is part of our role as the National Reference Laboratory for Influenza.
External quality assessment programmes
The PHAS participated in two external quality assessment programmes during 2024, including the Annual WHO External Quality Assessment Programme for influenza (WHO-EQAP) and the European External Influenza Virus Quality Assessment Programme (EEIQAP) panel from ERLI-Net. The results are described below.
Annual WHO External Quality Assessment Programme for influenza
The PHAS participated in the annual WHO External Quality Assessment Panel for influenza (no. 23) during 2024.
Molecular detection, typing, and sub/lineage-typing
Fifteen samples analysed by real-time PCR were correctly typed (A, B, or negative). One influenza A sample could not be subtyped with real-time PCR, but whole-genome sequencing established subtype A(H9), and this was confirmed in the final report. This procedure follows the routine protocol at the PHAS in cases where the influenza A subtype cannot be established but where virus titres are high enough for further investigation. Influenza A(H9) subtyping with real-time PCR is not performed at the PHAS.
Genetic characterisation
Genotyping analysis of the NA and PA genes was performed by NGS on an Ion Torrent platform, and the results were correct for all four samples.
European External Influenza Virus Quality Assessment Programme (EEIQAP) 2024
Molecular detection, typing, and sub/lineage-typing
Real-time PCR accurately detected the correct type in all 15 samples analysed. Three samples were positive for influenza A but could not be subtyped using the available real-time PCR typing methods. Three influenza A of swine origin were established with WGS. Subtyping of influenza A of swine origin with real-time PCR is not performed at the PHAS.
Genetic characterisation
Genetic characterisation was conducted on a total of 12 samples using WGS with an Ion Torrent platform. Among these, two samples tested negative. Accurate results were obtained for the remaining ten positive samples. For two of the samples (A/(H5N1)), the HA type could be determined while the NA type could not be due to low viral load.
Tables and figures
Respiratory viruses in Sweden during the 2024–2025 season
Figure 1. Number of weekly cases of COVID-19, influenza, and RSV during the winter seasons 2023–2024 and 2024–2025, summer period excluded.
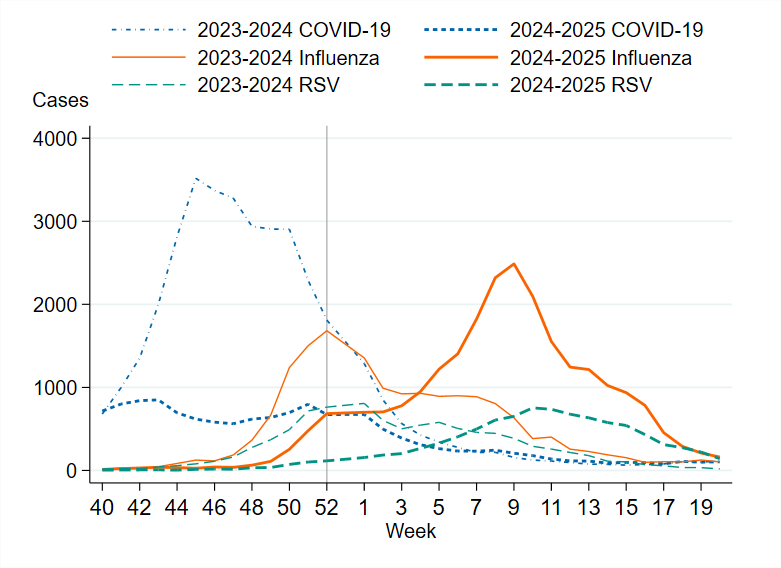
Figure 2. Number of weekly samples analysed for SARS-CoV-2, influenza, and RSV during the winter seasons 2023–2024 and 2024–2025, summer period excluded.
Testing for influenza
Figure 3. Number of samples analysed for influenza per week, per season, 2018–2019 to 2024–2025. Season 2020–2021 is excluded due to the small number of cases.
Laboratory-confirmed influenza cases
| Indicator | 2021–2022 | 2022–2023 | 2023–2024 | 2024–2025 |
|---|---|---|---|---|
| Analysed samples | 425,423 | 324,112 | 239,633 | 220,056 |
| Proportion positive samples | 3 % | 7 % | 7 % | 11 % |
| Total positive for influenza A | 13,150 | 17,848 | 15,291 | 20,496 |
| Total positive for influenza B | 137 | 5,167 | 1,169 | 3,710 |
| Total (influenza A + B) | 13,287 | 23,015 | 16,460 | 24,206 |
Figure 4. Total number of laboratory-confirmed cases of influenza (all types) per week and season, 2018–2019 to 2024–2025. Season 2020–2021 is excluded due to the small number of cases.
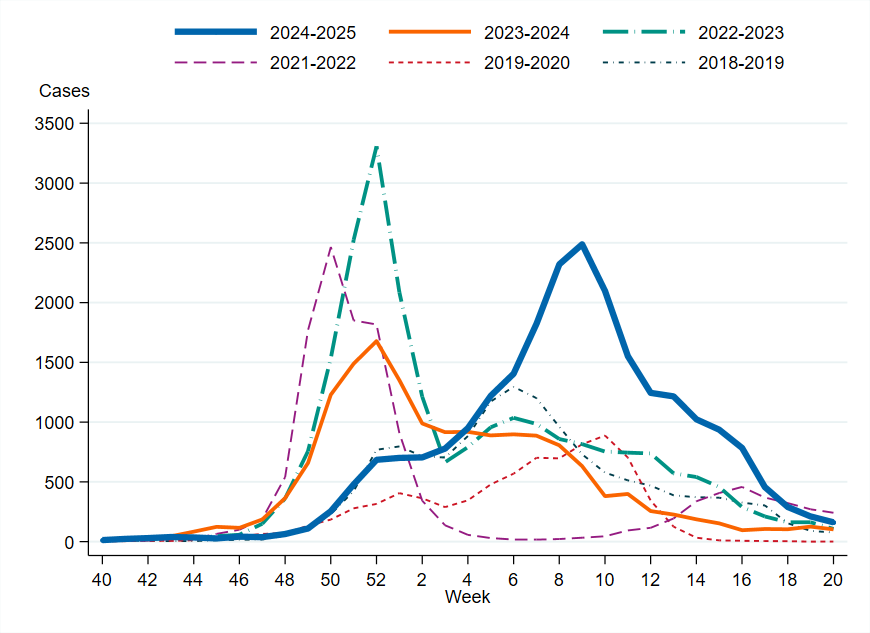
Figure 5. Percentage of samples testing positive for influenza, per week, 2018–2019 to 2024–2025. Season 2020–2021 is excluded due to the small number of cases.
Viral distribution by influenza type
Table 5 shows each influenza subtype/lineage as a percentage of all subtyped/lineage-typed samples during each respective season within the sentinel sampling season and the laboratory reporting system. Data on positive samples not analysed for subtype or lineage are excluded, as are samples subtyped as both influenza A(H3) and A(H1)pdm09.
| Influenza subtype/lineage | 2022–2023 Sent. | 2022–2023 Lab | 2023–2024 Sent. | 2023–2024 Lab | 2024–2025 Sent. | 2024–2025 Lab |
|---|---|---|---|---|---|---|
| A(H1N1)pdm09 | 32% | 48% | 69% | 63% | 50% | 61% |
| A(H3N2) | 4 % | 34% | 22% | 32% | 27% | 34% |
| B/Victoria | 21% | 19% | 8% | 5 % | 23% | 4% |
| B/Yamagata | 0% | 0% | 0% | 0% | 0% | 0% |
Figure 6. The number of subtyped influenza A cases in the laboratory reporting system per week, 2024–2025. Please note that the figure does not include unsubtyped influenza A cases, which made up the majority of influenza A cases during the season.
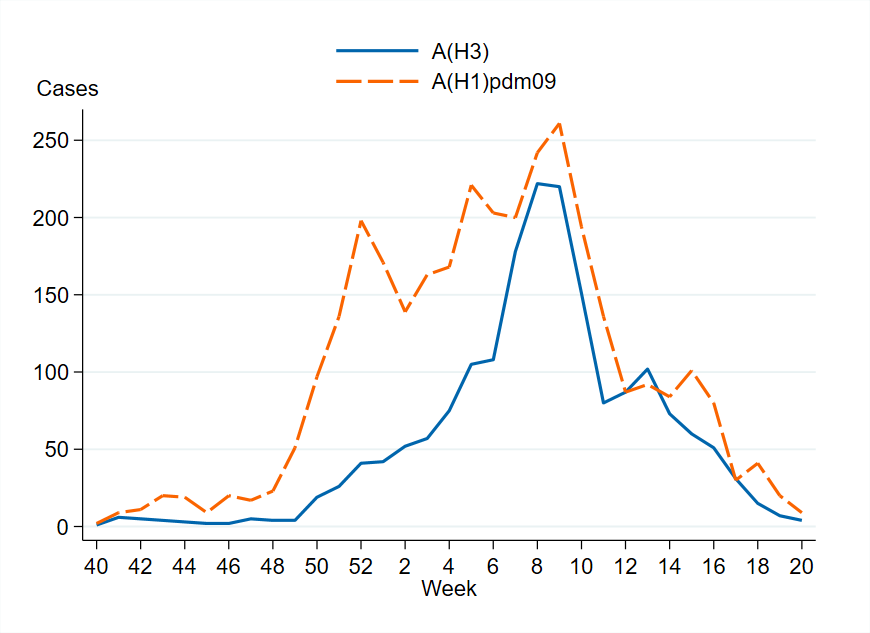
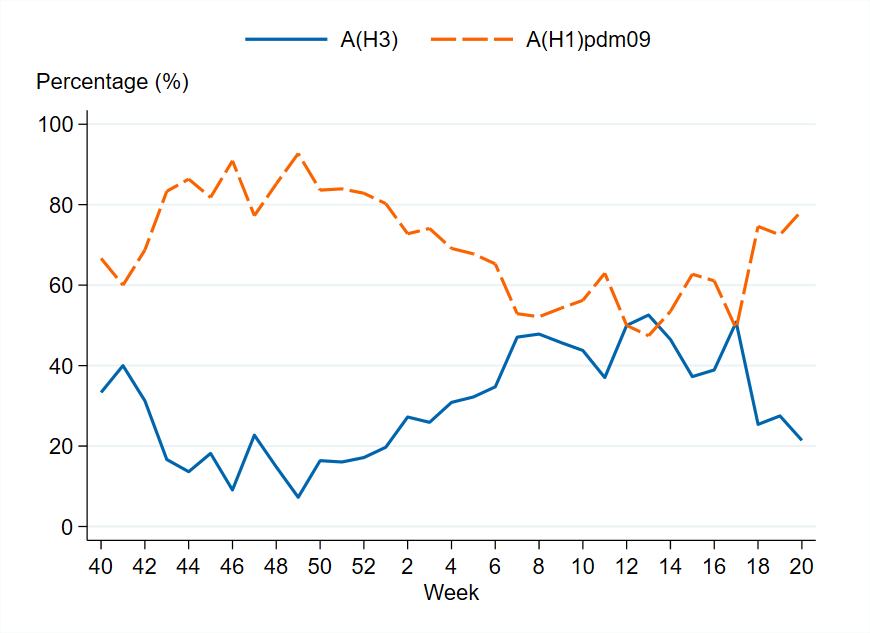
Figure 7. The weekly percentage of influenza A cases by subtype in the laboratory reporting system, 2024–2025. Please note that the figure does not include unsubtyped influenza A cases, which made up the majority of influenza A cases during the season.
Age and sex distribution of cases
Figure 8. Weekly notification rate (cases per 100,000 population) of influenza A per age group in Sweden, 2024–2025 season.
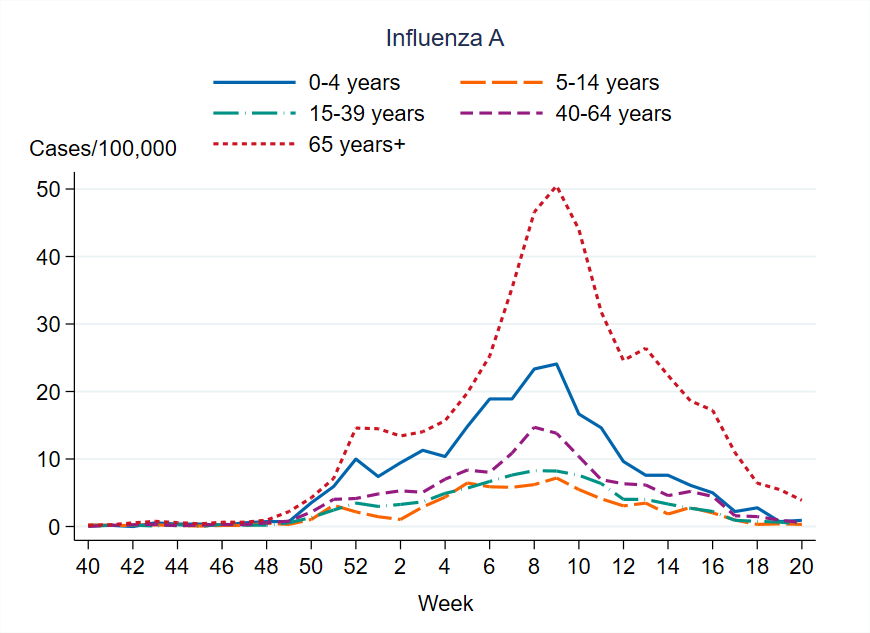
Figure 9. Weekly notification rate (cases per 100,000 population) of influenza B per age group in Sweden, 2024–2025 season.
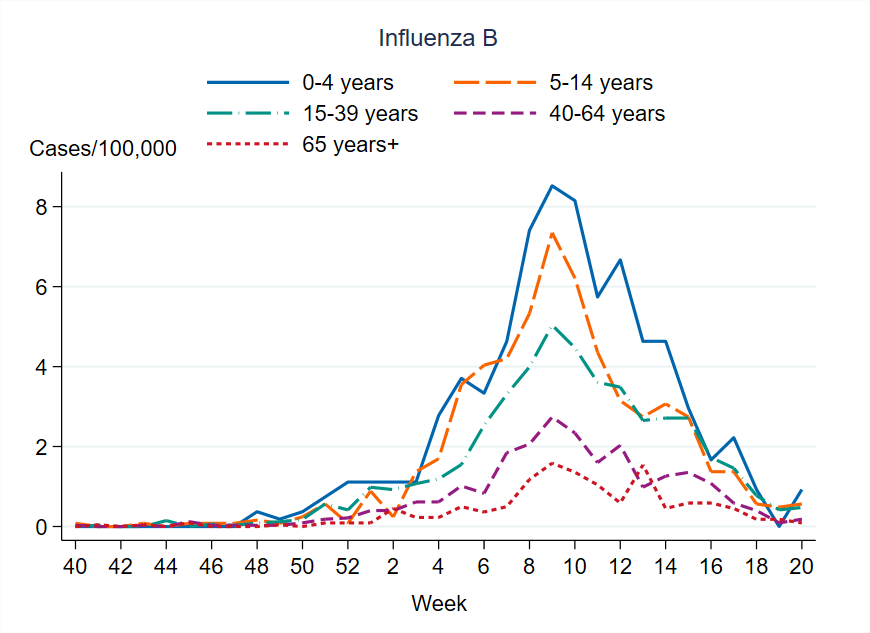
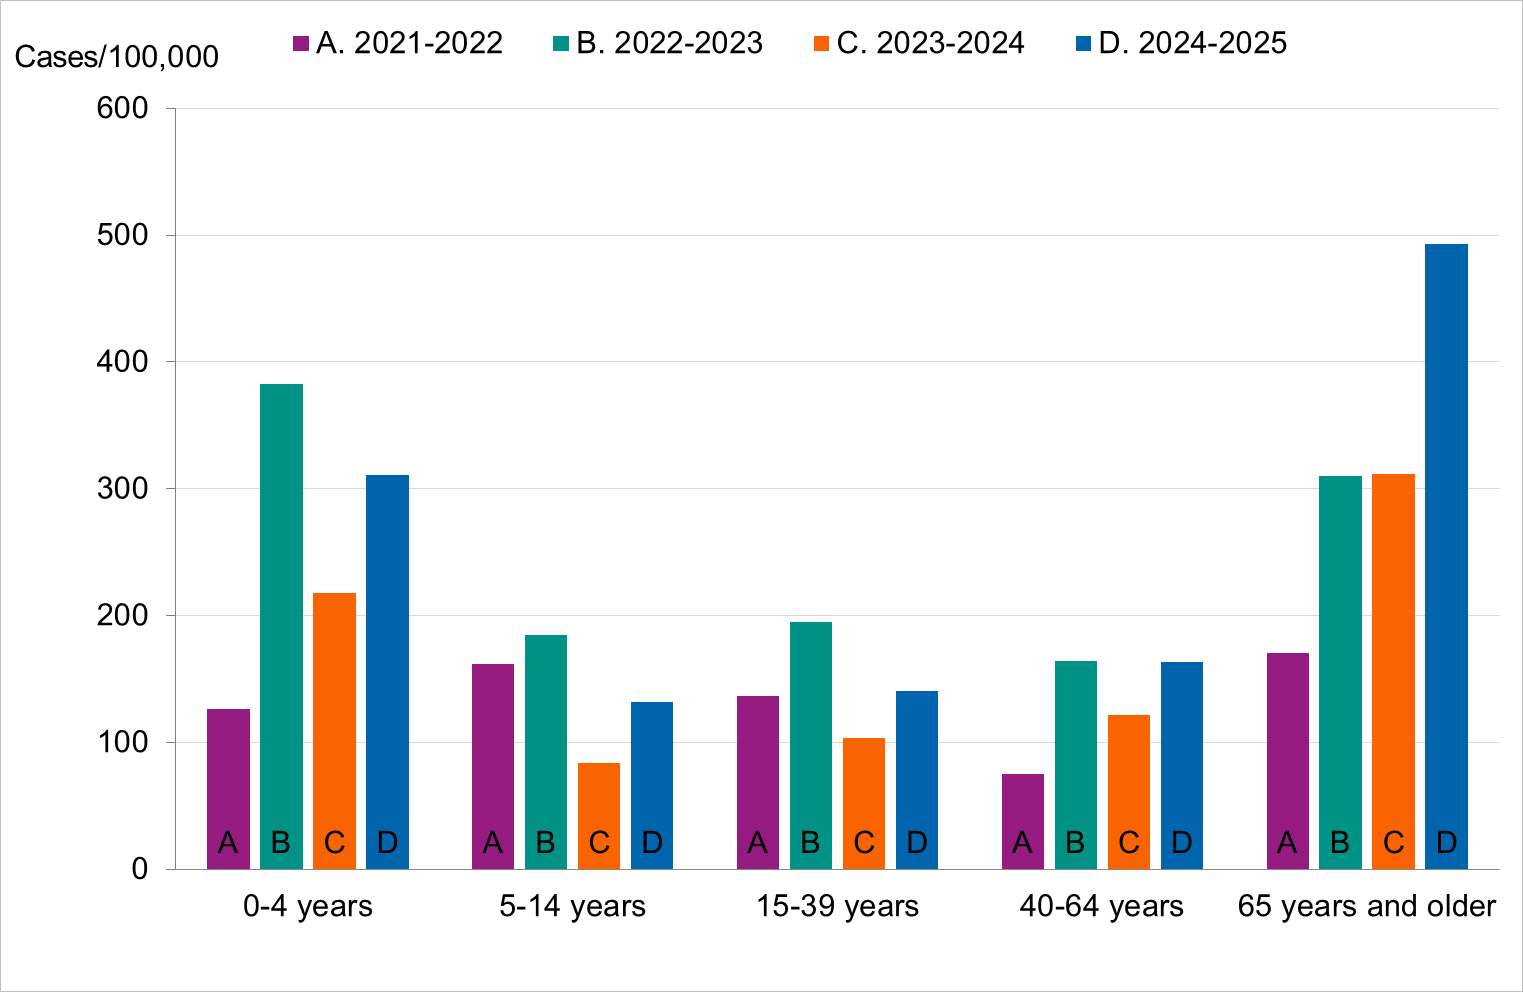
Figure 10. Cumulative notification rate (cases per 100,000 population) of laboratory-confirmed influenza cases per age group and season, Sweden, 2021–2022 to 2024–2025 seasons, in order from left to right.
Sentinel sampling
Figure 11. The weekly number of sentinel samples submitted and positive samples by influenza subtype/lineage, 2024–2025. The graph also includes positive SARS-CoV-2 and RSV samples. See Table 6 for underlying data.
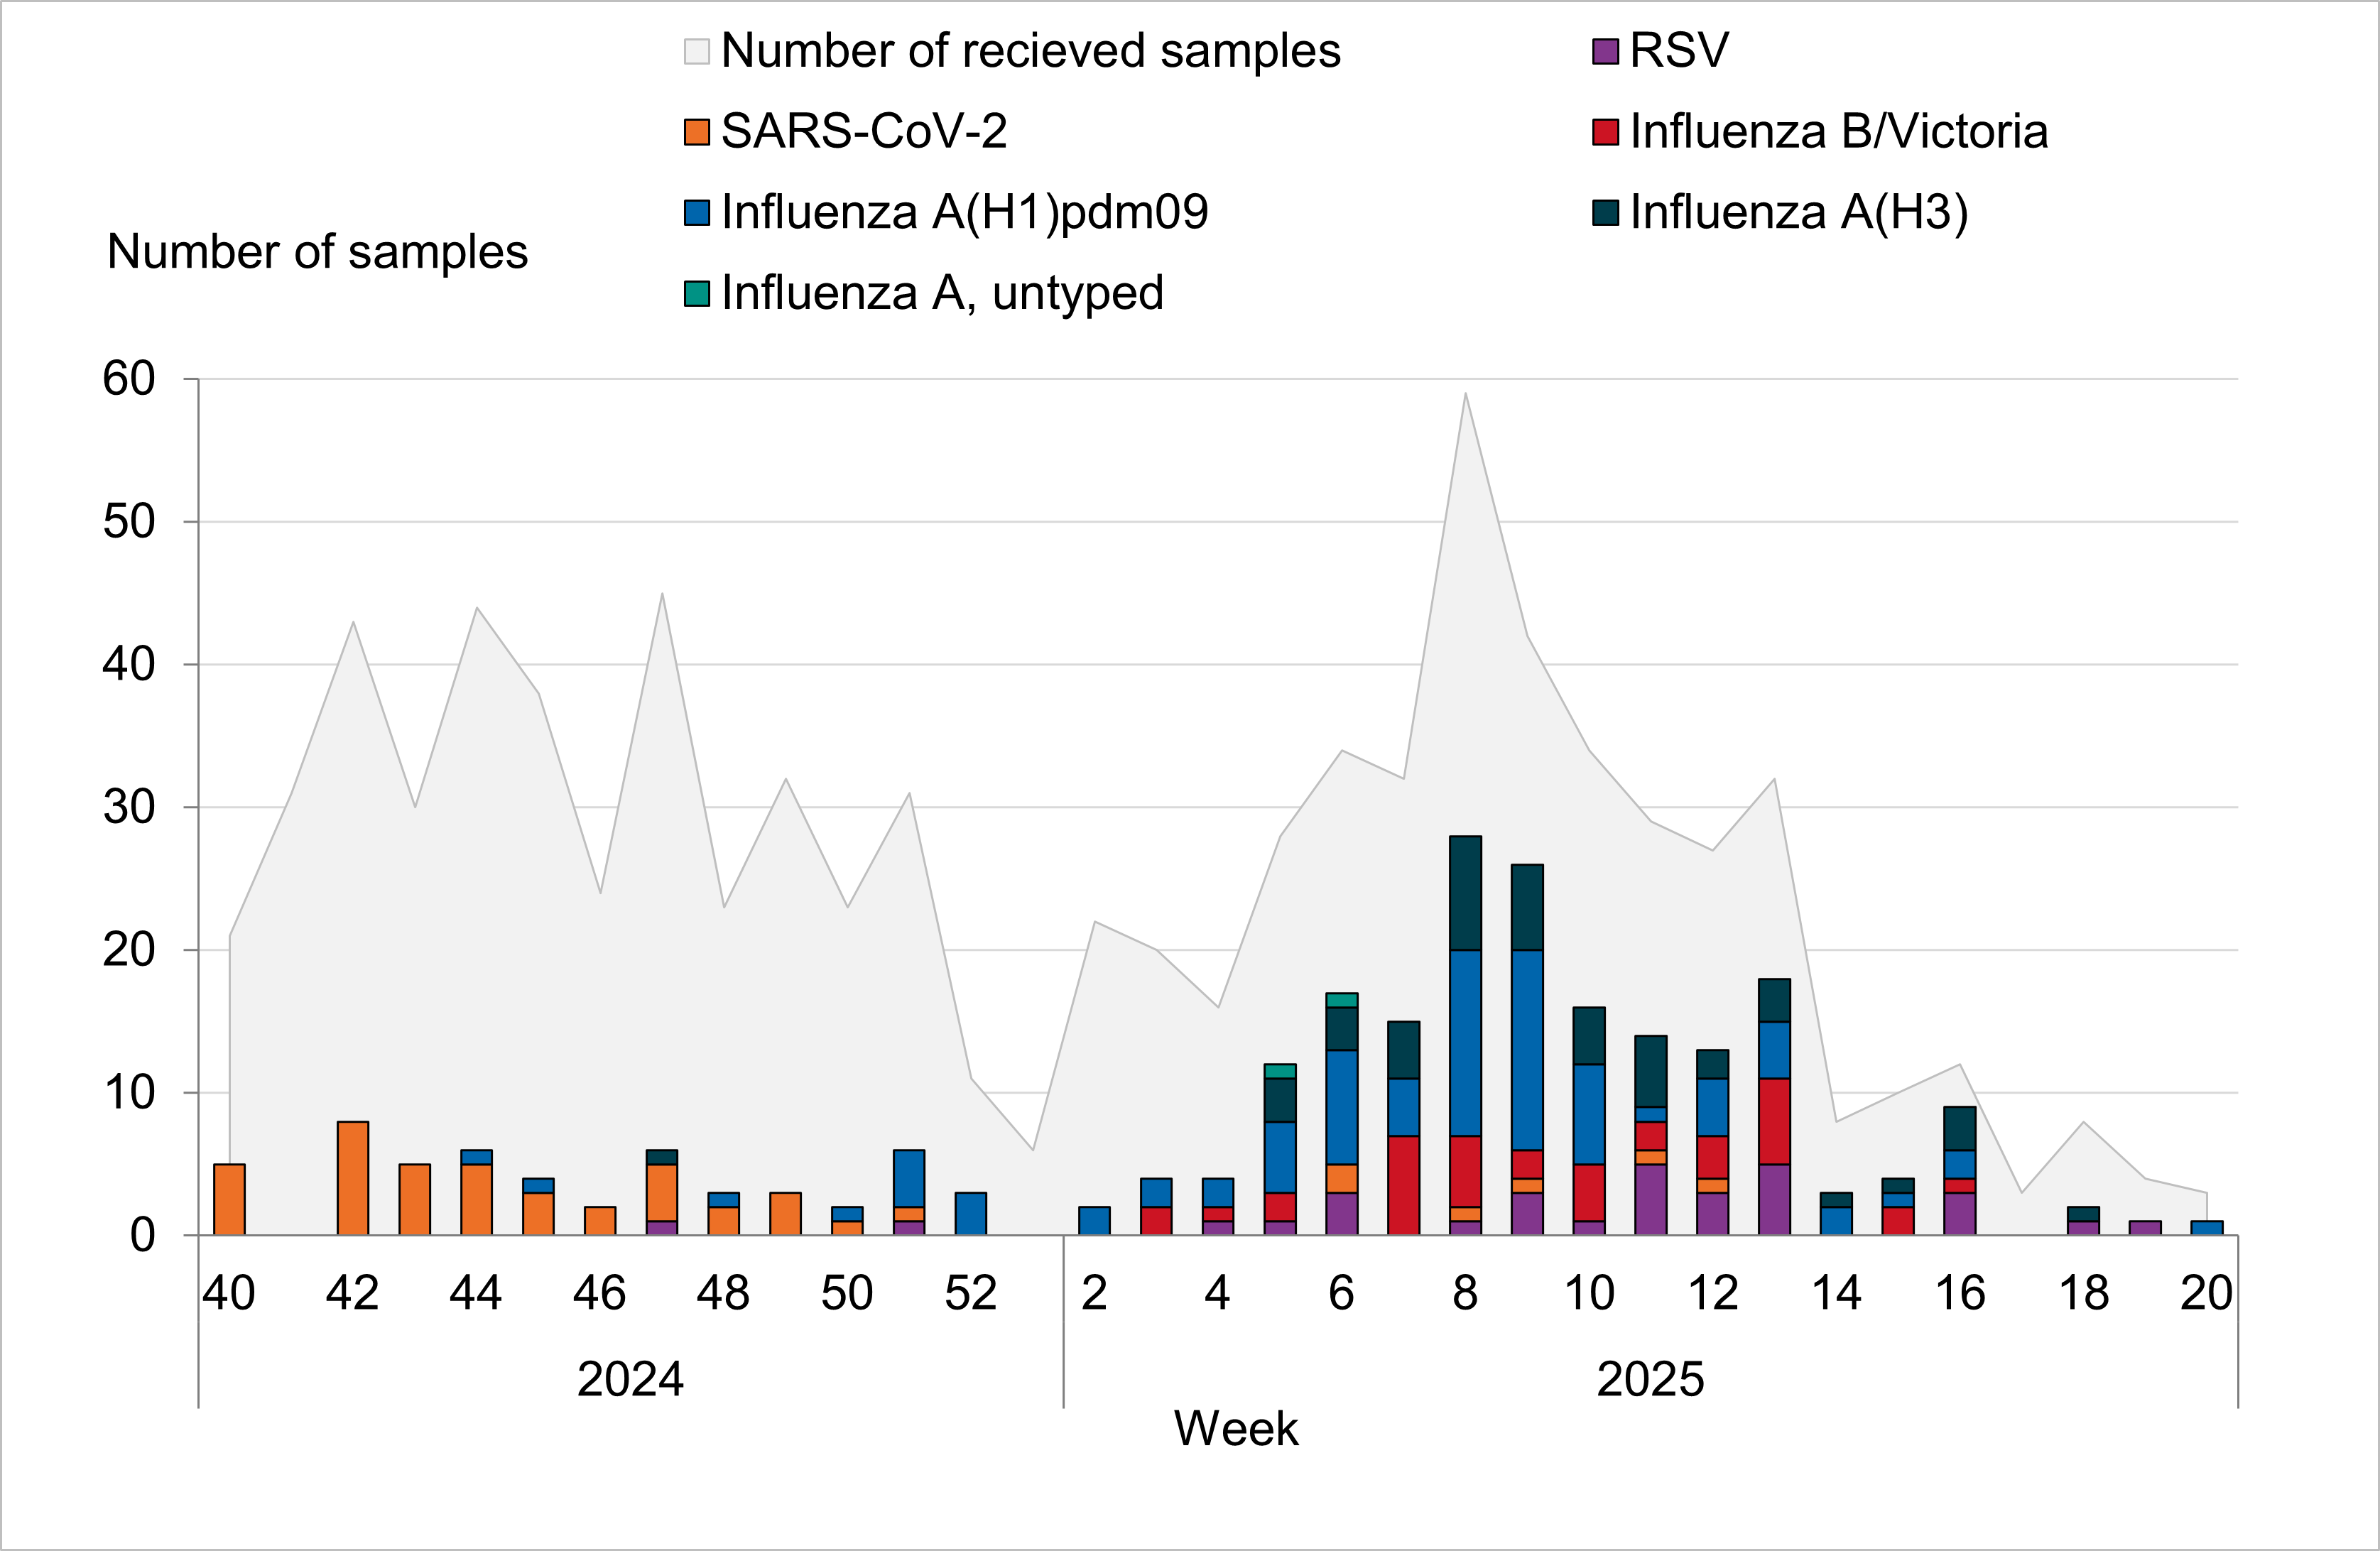
| Year, week | Number of samples | A(H1)pdm09 | A(H3) | A, not subtyped | B/Victoria | SARS-CoV-2 | RSV |
|---|---|---|---|---|---|---|---|
| 2024, 40 | 21 | 0 | 0 | 0 | 0 | 4 | 0 |
| 2024, 41 | 31 | 0 | 0 | 0 | 0 | 0 | 0 |
| 2024, 42 | 43 | 0 | 0 | 0 | 0 | 8 | 0 |
| 2024, 43 | 30 | 0 | 0 | 0 | 0 | 5 | 0 |
| 2024, 44 | 44 | 1 | 0 | 0 | 0 | 5 | 0 |
| 2024, 45 | 38 | 1 | 0 | 0 | 0 | 3 | 0 |
| 2024, 46 | 24 | 0 | 0 | 0 | 0 | 2 | 0 |
| 2024, 47 | 45 | 0 | 1 | 0 | 0 | 4 | 1 |
| 2024, 48 | 23 | 1 | 0 | 0 | 0 | 2 | 0 |
| 2024, 49 | 32 | 0 | 0 | 0 | 0 | 3 | 0 |
| 2024, 50 | 24 | 1 | 0 | 0 | 0 | 1 | 0 |
| 2024, 51 | 31 | 4 | 0 | 0 | 0 | 1 | 1 |
| 2024, 52 | 11 | 3 | 0 | 0 | 0 | 0 | 0 |
| 2025, 01 | 9 | 0 | 0 | 0 | 0 | 0 | 0 |
| 2025, 02 | 22 | 2 | 0 | 0 | 0 | 0 | 0 |
| 2025, 03 | 20 | 2 | 0 | 0 | 2 | 0 | 0 |
| 2025, 04 | 16 | 2 | 0 | 0 | 1 | 0 | 1 |
| 2025, 05 | 28 | 5 | 3 | 1 | 2 | 0 | 1 |
| 2025, 06 | 34 | 8 | 3 | 1 | 0 | 2 | 3 |
| 2025, 07 | 32 | 4 | 4 | 0 | 7 | 0 | 0 |
| 2025, 08 | 59 | 13 | 8 | 0 | 5 | 1 | 1 |
| 2025, 09 | 42 | 14 | 6 | 0 | 2 | 1 | 3 |
| 2025, 10 | 34 | 7 | 4 | 0 | 4 | 0 | 1 |
| 2025, 11 | 29 | 1 | 5 | 0 | 2 | 1 | 5 |
| 2025, 12 | 27 | 4 | 2 | 0 | 3 | 1 | 3 |
| 2025, 13 | 32 | 4 | 3 | 0 | 6 | 0 | 5 |
| 2025, 14 | 8 | 2 | 1 | 0 | 0 | 0 | 0 |
| 2025, 15 | 10 | 1 | 1 | 0 | 2 | 0 | 0 |
| 2025, 16 | 12 | 2 | 3 | 0 | 1 | 0 | 3 |
| 2025, 17 | 3 | 0 | 0 | 0 | 0 | 0 | 0 |
| 2025, 18 | 8 | 0 | 1 | 0 | 0 | 0 | 1 |
| 2025, 19 | 4 | 0 | 0 | 0 | 0 | 0 | 1 |
| 2025, 20 | 3 | 1 | 0 | 0 | 0 | 0 | 0 |
| Total | 829 | 83 | 45 | 2 | 37 | 44 | 30 |
| Samples | 2021–2022 | 2022–2023 | 2023–2024 | 2024–2025 |
|---|---|---|---|---|
| Analysed | 376 | 322 | 565 | 829 |
| Positive for influenza | 52 | 77 | 88 | 167 |
| Proportion positive | 14% | 24% | 16% | 20% |
| Positive for influenza A | 52 | 61 | 81 | 130 |
| Positive for influenza B | 0 | 16 | 7 | 37 |
| Type or subtype | 2022–2023 number | 2022–2023 median age | 2022–2023 ILI | 2023–2024 number | 2023–2024 median age | 2023–2024 ILI | 2024–2025 number | 2024–2025 median age | 2024–2025 ILI |
|---|---|---|---|---|---|---|---|---|---|
| Analysed | 322 | 47 | 81% | 565 | 47 | 81% | 829 | 46 | 83% |
| A(H1N1)pdm09 | 25 | 34 | 100% | 81 | 39 | 86% | 83 | 49 | 89% |
| A(H3N2) | 36 | 38 | 78% | 7 | 41 | 89% | 45 | 35 | 100% |
| A, not subtyped | - | - | - | 3 | 57 | 100% | 2 | 51 | 100% |
| B/Victoria | 16 | 33 | 100% | 7 | 29 | 100% | 37 | 30 | 97% |
| B/Yamagata | - | - | - | - | - | - | - | - |
Influenza cases in intensive care
| Type or subtype | 2021–2022 | 2022–2023 | 2023–2024 | 2024-2025 |
|---|---|---|---|---|
| Influenza A (not subtyped) | 84 | 196 | 225 | 172 |
| Influenza A(H1)pdm09 | 2 | 47 | 73 | 94 |
| Influenza A(H3) | 24 | 37 | 18 | 35 |
| Influenza B | 0 | 72 | 20 | 37 |
| Total | 110 | 352 | 335 | 338 |
Figure 12. Number of patients with influenza in intensive care by influenza subtype or lineage, per week, 2024–2025 season. See Table 10 for underlying data. One case subtyped as both A(H1)pdm09 and A(H3) is included as A (not subtyped) in the figure.
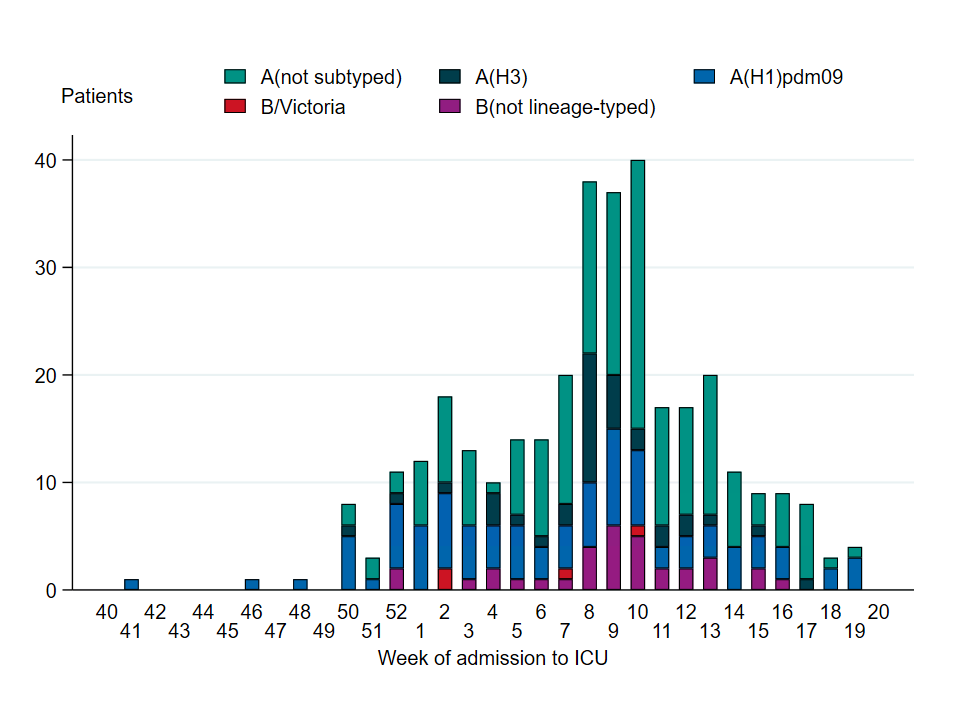
| Year, week | A(H1)pdm09 | A(H3) | A, not subtyped | B/Victoria | B, not lineage typed |
|---|---|---|---|---|---|
| 2024, 40 | 0 | 0 | 0 | 0 | 0 |
| 2024, 41 | 1 | 0 | 0 | 0 | 0 |
| 2024, 42 | 0 | 0 | 0 | 0 | 0 |
| 2024, 43 | 0 | 0 | 0 | 0 | 0 |
| 2024, 44 | 0 | 0 | 0 | 0 | 0 |
| 2024, 45 | 0 | 0 | 0 | 0 | 0 |
| 2024, 46 | 1 | 0 | 0 | 0 | 0 |
| 2024, 47 | 0 | 0 | 0 | 0 | 0 |
| 2024, 48 | 1 | 0 | 0 | 0 | 0 |
| 2024, 49 | 0 | 0 | 0 | 0 | 0 |
| 2024, 50 | 5 | 1 | 2 | 0 | 0 |
| 2024, 51 | 1 | 0 | 2 | 0 | 0 |
| 2024, 52 | 6 | 1 | 2 | 0 | 2 |
| 2025, 01 | 6 | 0 | 7 | 0 | 0 |
| 2025, 02 | 7 | 1 | 8 | 0 | 2 |
| 2025, 03 | 5 | 0 | 7 | 0 | 1 |
| 2025, 04 | 4 | 3 | 1 | 0 | 2 |
| 2025, 05 | 5 | 1 | 7 | 0 | 1 |
| 2025, 06 | 3 | 1 | 9 | 0 | 1 |
| 2025, 07 | 4 | 2 | 12 | 1 | 1 |
| 2025, 08 | 6 | 12 | 16 | 0 | 4 |
| 2025, 09 | 9 | 5 | 17 | 0 | 6 |
| 2025, 10 | 7 | 2 | 25 | 1 | 5 |
| 2025, 11 | 2 | 2 | 11 | 0 | 2 |
| 2025, 12 | 3 | 2 | 10 | 0 | 2 |
| 2025, 13 | 3 | 1 | 13 | 0 | 3 |
| 2025, 14 | 4 | 0 | 7 | 0 | |
| 2025, 15 | 3 | 1 | 3 | 0 | 2 |
| 2025, 16 | 3 | 0 | 5 | 0 | 1 |
| 2025, 17 | 1 | 0 | 6 | 0 | 0 |
| 2025, 18 | 2 | 0 | 1 | 0 | 0 |
| 2025, 19 | 3 | 0 | 1 | 0 | 0 |
| 2025, 20 | 0 | 0 | 0 | 0 | 0 |
| Total | 94 | 35 | 172 | 4 | 33 |
Figure 13. Cumulative incidence of patients with influenza in intensive care per week (patients per 100,000 population), per age group and season, Sweden, 2021–2022 to 2024–2025 seasons, in order from left to right.
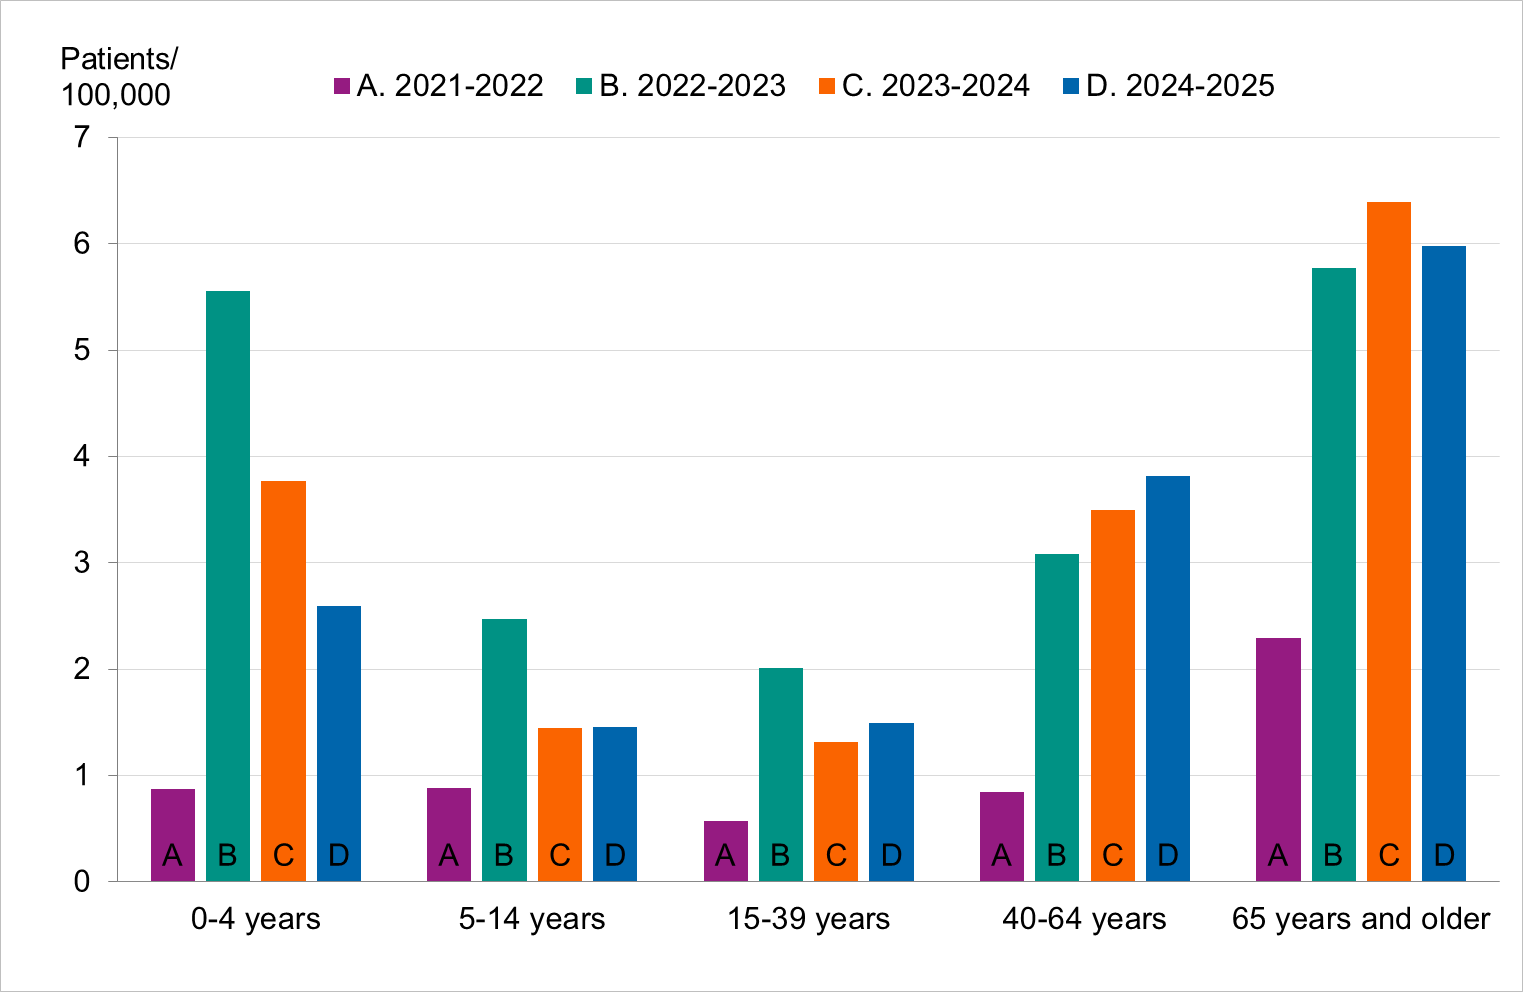
Figure 14. Weekly number of new patients with influenza in intensive care in Sweden, 2018–2019 to 2024–2025 seasons. Season 2020–2021 is not included due to the small number of cases.
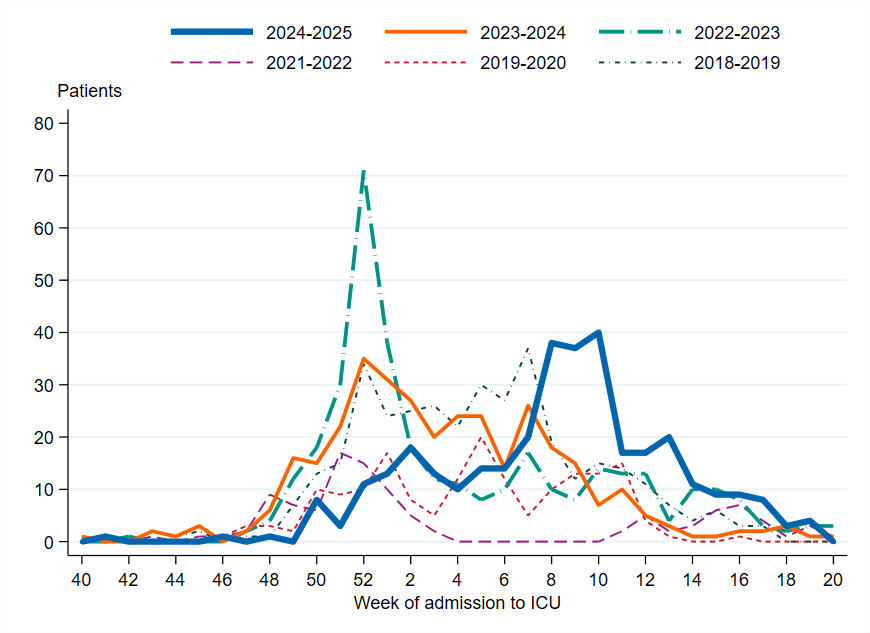
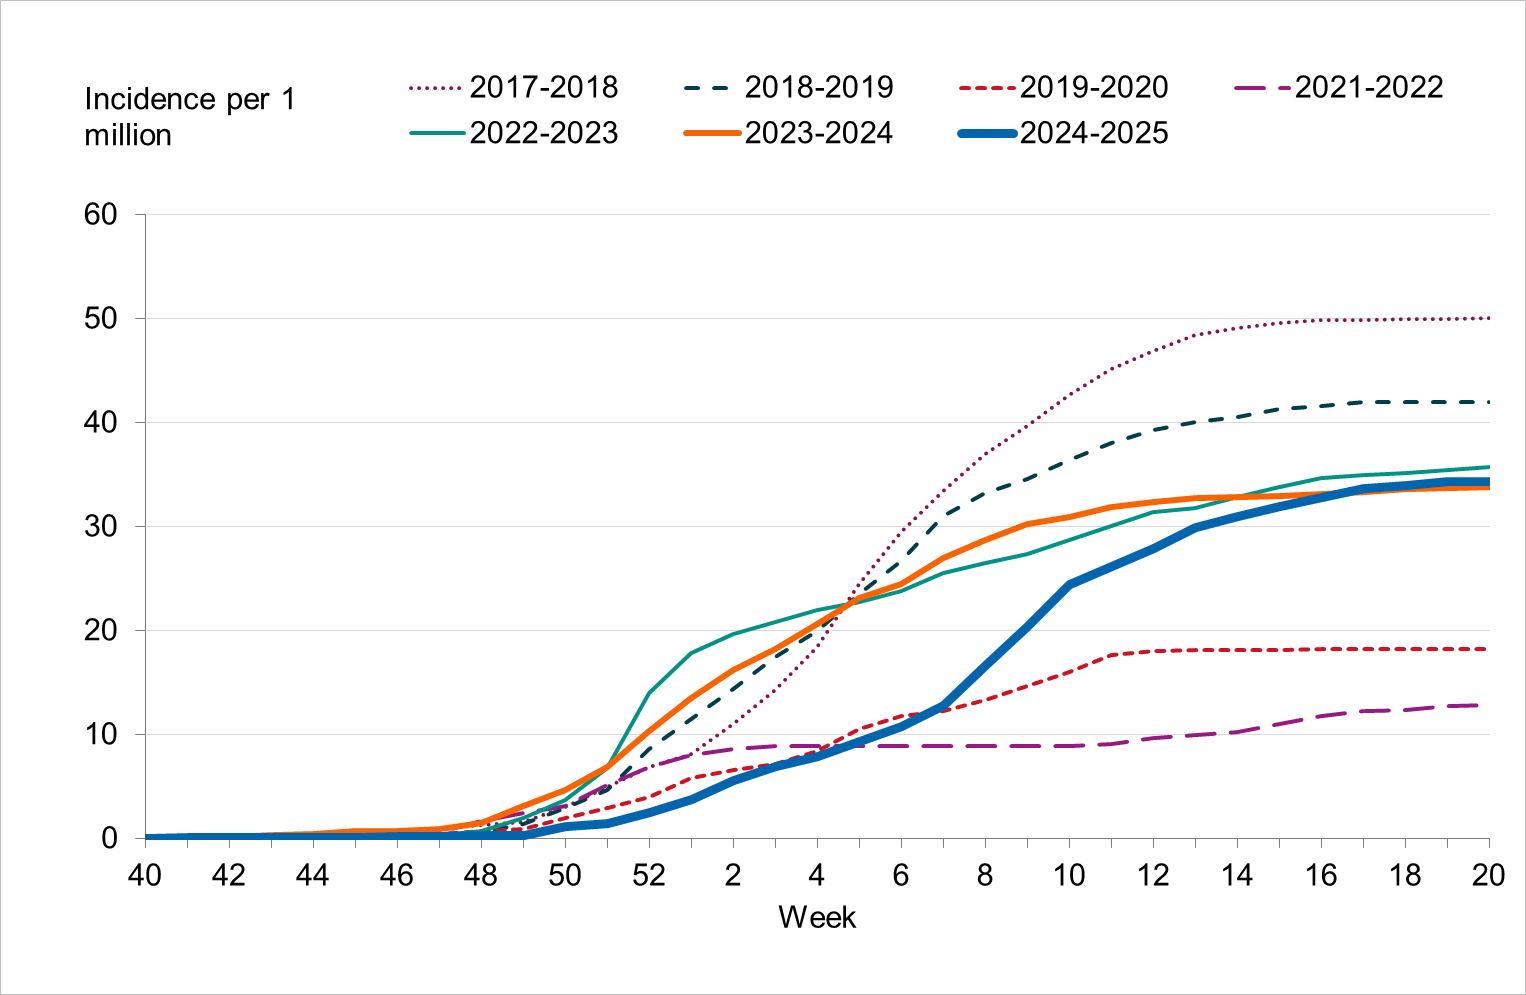
To enable comparison with the past seasons, the weekly cumulative incidence of patients in intensive care with influenza is shown for the past several seasons. When grouped in terms of highest to lowest cumulative incidence, the seasons can be roughly separated into three groups. The first is seasons with the highest cumulative incidence, namely 2017–2018, dominated by B/Yamagata, and 2018–2019, dominated by influenza A(H1N)pdm09. The second is the middle, including the three latest seasons (2022–2023 to 2024–2025), which had significant transmission of both influenza A subtypes. The third is those seasons with lower cumulative incidence, namely 2019–2020, which was a season with mixed circulation of influenza viruses, and 2021–2022, which was dominated by A(H3N2). Both of these seasons were of low-medium intensity and were seasons where the COVID-19 pandemic interrupted the transmission of influenza.
Figure 15. Cumulative incidence of patients with influenza in intensive care per week in Sweden, 2017–2018 to 2024–2025 seasons. Season 2020–2021 is not included due to the small number of cases.
Influenza-related mortality
Deaths within 30 days
The table below uses data on deaths retrieved from Swedish Tax Agency data on July 16, 2025, on cases from week 40, 2024, to week 20, 2025, with reported age. Status after 30 days could not be ascertained for 185 cases whose personal identification number was not included in the case report, and these have been excluded from the analysis.
| Indicator | <40 years> | 40–64 years | 65–69 years | 70–74 years | 75–79 years | 80–84 years | 85–89 years | 90–94 years | ≥95 years | Total |
|---|---|---|---|---|---|---|---|---|---|---|
| Total Cases | 7,970 | 5,295 | 1,385 | 1,701 | 2,378 | 2,465 | 1,752 | 902 | 274 | 24,122 |
| Cases/100,000 | 155 | 163 | 253 | 335 | 473 | 696 | 927 | 1,126 | 1,123 | 228 |
| Total Deaths | 22 | 60 | 40 | 80 | 141 | 210 | 174 | 148 | 57 | 932 |
| Deaths/100,000 | 0,4 | 2 | 7 | 16 | 28 | 59 | 92 | 185 | 234 | 9 |
| Deaths among cases | 0.3% | 1.1% | 2.9% | 4.7% | 5.9% | 8.5% | 10% | 16% | 21% | 3.9% |
Figure 16. Weekly number of deaths among laboratory-confirmed influenza cases by subtype or lineage, per week, 2024–2025 season. See Table 12 for underlying data. The figure does not include a small number of deaths occurring after week 20.
| Year, week | A(H1)pdm09 | A(H3) | A, not subtyped | B/Victoria | B, not lineage typed |
|---|---|---|---|---|---|
| 2024, 40 | 0 | 0 | 0 | 0 | 0 |
| 2024, 41 | 0 | 0 | 0 | 0 | 0 |
| 2024, 42 | 0 | 0 | 0 | 0 | 0 |
| 2024, 43 | 0 | 0 | 0 | 0 | 0 |
| 2024, 44 | 0 | 1 | 0 | 0 | 0 |
| 2024, 45 | 1 | 0 | 0 | 0 | 0 |
| 2024, 46 | 0 | 0 | 2 | 0 | 0 |
| 2024, 47 | 0 | 0 | 1 | 0 | 0 |
| 2024, 48 | 1 | 1 | 1 | 0 | 0 |
| 2024, 49 | 3 | 0 | 1 | 0 | 0 |
| 2024, 50 | 2 | 0 | 5 | 0 | 0 |
| 2024, 51 | 6 | 0 | 10 | 0 | 0 |
| 2024, 52 | 5 | 1 | 16 | 0 | 0 |
| 2025, 01 | 6 | 2 | 15 | 0 | 0 |
| 2025, 02 | 8 | 0 | 19 | 0 | 0 |
| 2025, 03 | 9 | 2 | 19 | 0 | 1 |
| 2025, 04 | 3 | 2 | 18 | 0 | 0 |
| 2025, 05 | 11 | 3 | 26 | 0 | 2 |
| 2025, 06 | 6 | 5 | 37 | 0 | 1 |
| 2025, 07 | 12 | 12 | 49 | 1 | 1 |
| 2025, 08 | 7 | 9 | 75 | 0 | 2 |
| 2025, 09 | 15 | 13 | 72 | 1 | 1 |
| 2025, 10 | 7 | 8 | 68 | 0 | 5 |
| 2025, 11 | 13 | 5 | 53 | 0 | 1 |
| 2025, 12 | 4 | 2 | 40 | 0 | 1 |
| 2025, 13 | 1 | 3 | 41 | 0 | 1 |
| 2025, 14 | 6 | 1 | 32 | 0 | 1 |
| 2025, 15 | 2 | 2 | 24 | 0 | 2 |
| 2025, 16 | 2 | 0 | 36 | 0 | 3 |
| 2025, 17 | 3 | 1 | 17 | 0 | 0 |
| 2025, 18 | 2 | 0 | 8 | 0 | 0 |
| 2025, 19 | 1 | 0 | 11 | 0 | 0 |
| 2025, 20 | 1 | 0 | 2 | 0 | 0 |
| Total | 137 | 73 | 698 | 2 | 22 |
Figure 17. Weekly number of deaths among influenza cases in Sweden, 2021–2022 to 2024–2025 seasons.
Excess mortality
The PHAS monitors excess mortality through the EuroMOMO model, which estimates the crude excess mortality for the whole country by age group and regionally compared to baseline expected levels. Excess mortality during the winter may be related to a number of factors, including influenza and other respiratory infections or to periods of extremely cold temperatures.
Figure 18. Number of crude and expected (baseline) deaths per week in the age group 65 years and older, Sweden, 2018 (week 52) to 2025 (week 27). The line that follows an even, wave-like pattern is the expected number of deaths, while the more varying line is the actual number of deaths per week.
Vaccination coverage
There is no national register for influenza vaccinations in Sweden. Instead, the vaccination coverage is estimated among persons 65 years of age by each of Sweden’s 21 county medical officers for their respective regions (also known as county councils). Various methods for estimation have been used in different regions, see Comments on vaccination data.
Coverage among persons 65 years of age and older
Figure 19. Vaccination coverage among persons aged 65 and older in Sweden, 2017–2018 to 2024–2025.
Vaccination coverage among persons under 65 years
It is difficult to estimate vaccination coverage among the medical risk groups under 65 years of age because these groups are hard to define and data on risk group status is not usually collected. A subset of Swedish regions, accounting for approximately 77 percent of the total population, has reported data that enable the estimation of coverage per age group, see Table 13 and the section Comments on vaccination data.
| Age group | Population 31 dec 2024 | Percentage vaccinated |
|---|---|---|
| 0–4 years | 411 160 | 0.3% |
| 5–17 years | 1 239 359 | 0.4% |
| 18–39 years | 2 248 077 | 2% |
| 40–64 years | 2 499 284 | 7% |
| 65–79 years | 1 199 846 | 61% |
| 80+ years | 500 876 | 81% |
| Total | 8 098 602 | 17% |
Comments on vaccination data
Influenza vaccinations are not entered in the national vaccination register. Various methods for estimating vaccination coverage among persons 65 years of age and older have been used in each of the 21 Swedish regions, including the use of vaccination registries, the number of vaccine doses given or distributed, sentinel reports on vaccination coverage, surveys among general practitioners, and patient record data. These methodological differences result in coverage estimates of varying quality and precision. Although the methods vary between regions, the methods within most regions have been roughly the same for the past several years, thus allowing a comparison over time.
Data used to estimate the vaccination coverage by age group (see Table 13) includes data from all regions except Uppsala, Örebro, and Västra Götaland.
Vaccination coverage estimates were calculated using the population data from December 31 of each year (Source: Statistics Sweden). Changes in data sources and data excluded per region are noted in the Swedish-language weekly report for week 20, 2025 (9). For some regions, data sources do not include all doses given, e.g. doses given within municipal elderly care, at hospitals, or by private vaccination units.
References
- Public Health Agency of Sweden. Publikationer [Publications]. [Internet]. Stockholm: Public Health Agency of Sweden; 2025 [cited 2025-07-29] Available from: https://www.folkhalsomyndigheten.se/publikationer-och-material/publikationer/
- Ujvari Dorina, Samuelsson Hagey Tove, Carnahan AnnaSara, Latorre-Margalef Neus. Novel influenza A(H1N2) seasonal reassortant virus identified in a patient, Sweden, April 2025. Euro Surveill. 2025;30(31):pii=2500542. https://doi.org/10.2807/1560-7917.ES.2025.30.31.2500542
- European Respiratory Virus Surveillance Summary (Erviss). [Internet.] Stockholm: European Centre for Disease Prevention and Control and Copenhagen: World Heatlh Organisation – European region office; 2025 [cited 2025-08-06] Available from: https://erviss.org/
- EuroMOMO Reports and Publications, [Internet]. Denmark: Statens Serum Institut; 2025 [cited 2025-07-29] Available from: https://euromomo.eu/how-it-works/reports-and-publications.
- Vaccine Effectiveness, Burden and Impact Studies (VEBIS). [Internet.] Stockholm: European Centre for Disease Prevention and Control; 2025 [cited 2025-07-29] Available from: https://www.ecdc.europa.eu/en/infectious-disease-topics/related-public-health-topics/immunisation-and-vaccines/vaccine-0
- European Centre for Disease Prevention and Control/World Health Organisation Regional Office for Europe European Respiratory Virus Surveillancery (ERVISS) Overview of respiratory virus epidemiology in the EU/EEA, week 40 (2024) -20 (2025). [Published n.d, cited 2025-07-31]. Available from: https://erviss.org/
- World Health Organization, Recommendations announced for influenza vaccine composition for the 2024-2025 northern hemisphere influenza [Internet]. Geneva: World Health Organization; 2024. [published 2024-02-23, cited 2025-07-31]. Available from: https://www.who.int/news/item/23-02-2024-recommendations-announced-for-influenza-vaccine-composition-for-the-2024-2025-northern-hemisphere-influenza-season
- World Health Organization, Recommended composition of influenza virus vaccines for use in the 2025–2026 northern hemisphere influenza season. [Internet]. Geneva: World Health Organization; 2025. [published 2025-02-28, cited 2025-07-31]. Available from: https://www.who.int/publications/m/item/recommended-composition-of-influenza-virus-vaccines-for-use-in-the-2025-2026-nh-influenza-season
- Public Health Agency of Sweden, Influensarapport vecka 20, säsongen 2024-2025 [Influenza Report for week 20, 2024-2025 Season]. [Internet]. Stockholm: Public Health Agency of Sweden; 2025 [cited 2025-07-29] Available from: https://www.folkhalsomyndigheten.se/folkhalsorapportering-statistik/statistik-a-o/sjukdomsstatistik/influensa-veckorapporter/arkiv-for-influensa-veckorapporter/arkiv-20242025-for-influensa-veckorapporter/
Appendices
Appendices 1, 2, and 3 contain phylogenetic trees for influenza A(H3N2), influenza A(H1N1)pdm09, and influenza B/Victoria, respectively. These are available upon request. Please provide the article number and the title of the report. The registrar will notify you if your document request entails a fee.